The US dollar index fluctuated at high levels, with easing geopolitical tensions putting downward pressure on the dollar, but expectations of interest rate hikes still providing support.
2026-06-09 14:26:14
The US dollar index continued its volatile trading session in Asian trading on Tuesday, hovering around 99.80. Recent tensions in the Middle East have eased somewhat, with Iran and Israel agreeing to a pause in their attacks, following President Trump's call for de-escalation. This has reduced market risk aversion in the short term, weakening the dollar's support.
However, the situation is far from completely stable. Israeli Prime Minister Netanyahu stated that the war against Iran and its allies is "not over," despite both sides having weakened. The Iranian military confirmed it has ceased attacks on Israel, but the central military command warned that if Israel continues its attacks in southern Lebanon, it will face "a more severe response than before." This uncertainty could still stimulate safe-haven buying of the US dollar at crucial moments.
Furthermore, strong U.S. employment data continues to boost market expectations for inflation and Federal Reserve policy. Investors are concerned that inflation may continue to rise, thereby increasing the probability of interest rate hikes. According to the CME Group's FedWatch tool, the market expects the probability of a 25 basis point rate hike by the Fed in December to rise to 42%, significantly higher than 14% a month ago. This change provides potential support for the US dollar while exerting some downward pressure on non-yielding assets such as silver and gold.
In the short term, investors will closely watch US CPI and PPI data, as these two indicators will determine market expectations for the Federal Reserve's future interest rate path. If inflation data is strong, the dollar may continue its volatile but upward trend; if the data falls short of expectations, the dollar may decline in the short term. Overall, the dollar index is under the dual influence of geopolitical factors and expectations regarding Federal Reserve policy, and short-term volatility is expected to increase.
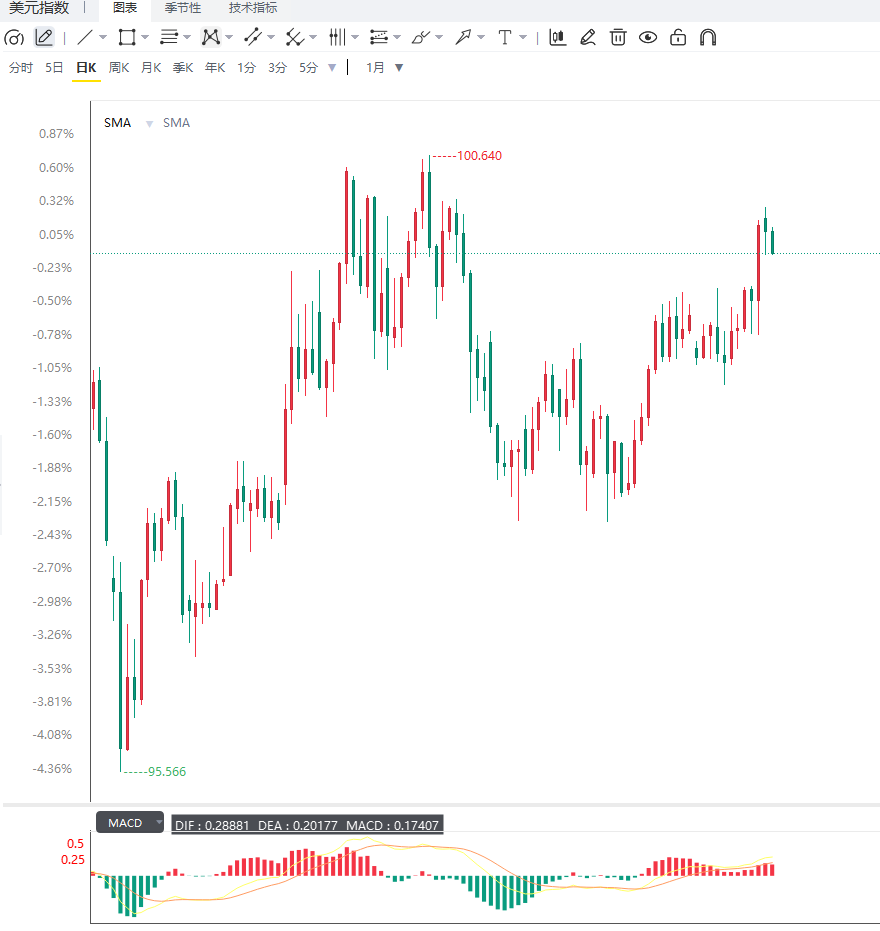
The daily chart shows the US dollar index consolidating around the 100 level, with an overall medium-term trend leaning towards neutral to bullish. The MACD indicator remains near the zero line, with alternating red and green bars indicating a balance between bullish and bearish forces. The RSI indicator hovers around 50, suggesting cautious short-term market sentiment. Key resistance levels to watch are 100.50, 101.00, and 101.50, while key support levels are 99.50, 99.00, and 98.50.
The 4-hour chart shows that the US dollar index is currently in a range-bound trading pattern, with the MACD indicator crossing near the zero line, indicating weak short-term momentum. The RSI indicator remains at a neutral level. A break above the 100.50 resistance level could test 101.00 and 101.50; a break below the 99.50 support level could lead to a pullback to the 99.00 and 98.50 areas.
Editor's Summary : The US dollar index is expected to maintain a volatile pattern in the short term. The temporary easing of tensions in the Middle East has reduced safe-haven demand, but uncertainty remains. Rising expectations of a Fed rate hike are providing support for the dollar. This week's US CPI and PPI data will be key factors determining the dollar's short-term direction. Overall, the dollar is likely to remain volatile around the 100 level in the short term, experiencing periodic fluctuations under the combined influence of geopolitical risks and policy expectations.
However, the situation is far from completely stable. Israeli Prime Minister Netanyahu stated that the war against Iran and its allies is "not over," despite both sides having weakened. The Iranian military confirmed it has ceased attacks on Israel, but the central military command warned that if Israel continues its attacks in southern Lebanon, it will face "a more severe response than before." This uncertainty could still stimulate safe-haven buying of the US dollar at crucial moments.
Furthermore, strong U.S. employment data continues to boost market expectations for inflation and Federal Reserve policy. Investors are concerned that inflation may continue to rise, thereby increasing the probability of interest rate hikes. According to the CME Group's FedWatch tool, the market expects the probability of a 25 basis point rate hike by the Fed in December to rise to 42%, significantly higher than 14% a month ago. This change provides potential support for the US dollar while exerting some downward pressure on non-yielding assets such as silver and gold.
In the short term, investors will closely watch US CPI and PPI data, as these two indicators will determine market expectations for the Federal Reserve's future interest rate path. If inflation data is strong, the dollar may continue its volatile but upward trend; if the data falls short of expectations, the dollar may decline in the short term. Overall, the dollar index is under the dual influence of geopolitical factors and expectations regarding Federal Reserve policy, and short-term volatility is expected to increase.
The daily chart shows the US dollar index consolidating around the 100 level, with an overall medium-term trend leaning towards neutral to bullish. The MACD indicator remains near the zero line, with alternating red and green bars indicating a balance between bullish and bearish forces. The RSI indicator hovers around 50, suggesting cautious short-term market sentiment. Key resistance levels to watch are 100.50, 101.00, and 101.50, while key support levels are 99.50, 99.00, and 98.50.
The 4-hour chart shows that the US dollar index is currently in a range-bound trading pattern, with the MACD indicator crossing near the zero line, indicating weak short-term momentum. The RSI indicator remains at a neutral level. A break above the 100.50 resistance level could test 101.00 and 101.50; a break below the 99.50 support level could lead to a pullback to the 99.00 and 98.50 areas.
Editor's Summary : The US dollar index is expected to maintain a volatile pattern in the short term. The temporary easing of tensions in the Middle East has reduced safe-haven demand, but uncertainty remains. Rising expectations of a Fed rate hike are providing support for the dollar. This week's US CPI and PPI data will be key factors determining the dollar's short-term direction. Overall, the dollar is likely to remain volatile around the 100 level in the short term, experiencing periodic fluctuations under the combined influence of geopolitical risks and policy expectations.
- Risk Warning and Disclaimer
- The market involves risk, and trading may not be suitable for all investors. This article is for reference only and does not constitute personal investment advice, nor does it take into account certain users’ specific investment objectives, financial situation, or other needs. Any investment decisions made based on this information are at your own risk.