The long-term bullish logic remains unchanged, but the 200-day moving average has been broken: Gold hovers around 4330, awaiting a breakthrough in CPI.
2026-06-09 15:20:35
On Tuesday (June 9) during the Asian session, spot gold prices briefly broke through the $4,350.00/ounce mark before retreating and are currently trading around $4,330/ounce.
Gold has faced strong pressure in recent weeks, with the pullback gradually building momentum since peaking at the end of January.
The overall outlook for gold is becoming increasingly challenging. Soaring global bond yields, a resilient US economy, and a stronger dollar are collectively diminishing the appeal of gold as a non-interest-bearing asset. While structural support for gold remains in the long term, the short-term outlook has turned bearish.

In the long term, the structural factors supporting gold's rise remain unchanged. Continued concerns about fiscal deficits, global central bank reserve diversification, and inflation risks should continue to provide support during significant gold price corrections.
However, the balance of risks appears poised to weaken further in the coming weeks before a more sustained recovery emerges.
Gold prices have weakened somewhat recently due to a market reassessment of the outlook for U.S. interest rates. Recent economic data has generally exceeded expectations, reinforcing the view that the Federal Reserve is more likely to tighten than ease policy later this year.
Stronger-than-expected labor market data released last Friday confirmed this view, pushing up US Treasury yields and supporting the dollar. This combination is unfavorable for gold, and recent price movements reflect this dynamic.
Market attention has now shifted to the upcoming US inflation data, which could play a decisive role in the short-term market direction.
Wednesday's May CPI report is the most crucial economic event of the week, with economists generally expecting overall inflation to rise to 4.2% year-on-year, a more than three-year high.
If inflation readings remain firm, it will confirm recent concerns from Federal Reserve Chairman Warsh and other officials about lingering price pressures, reinforcing market expectations that interest rates will remain high for an extended period. This could provide further support for the dollar while putting downward pressure on prices of precious metals such as gold. Conversely, if inflation unexpectedly weakens, it could reverse recent hawkish pricing, providing some breathing room for gold.
Meanwhile, developments in the energy market remain crucial. Despite the ceasefire announced by Iran and Israel, shipping through the Strait of Hormuz remains severely restricted, and crude oil prices are holding above $90. Continued disruptions to global supply chains will make it difficult for inflation concerns to dissipate quickly, thus limiting the upside potential for gold. The market will be closely watching inflation data and further developments in the Middle East situation.
Perhaps the most significant technical development is that gold has fallen below its 200-day moving average. The last time gold closed below this closely watched indicator was in September 2023, when that drop led to a roughly 5% decline in the following ten to eleven trading days before buyers returned and pushed prices back above the moving average in mid-October.
Since then, gold has tested the 200-day moving average three more times: the first time in November 2023 and the second time in March of this year. Both tests triggered significant rebounds, reinforcing the importance of this level as a long-term support area.
Gold prices have now fallen below this moving average, signaling a potential significant shift in market behavior. Technical traders typically view such moves as confirmation of a weakening long-term trend, which could encourage renewed selling pressure during short-term rallies.
Gold prices failed to hold above $4,500, ultimately making the market vulnerable to a deeper correction, and the break below the 200-day moving average accelerated the downward momentum.
The next major support zone for spot gold is a long-term uptrend line around $4,230. Below this, support levels become sparse until around the March low of $4,100, which could create room for a more significant decline if bears maintain control. Given the current market structure, a move towards the psychologically important $4,000 level cannot be ruled out.
On the upside, initial resistance is around $4366, followed by $4400, $4455, and the previous key resistance level of $4500. A rebound above these levels would help stabilize market sentiment, but a more substantial improvement in the outlook would require a decisive break above the broader resistance zone around $4580.
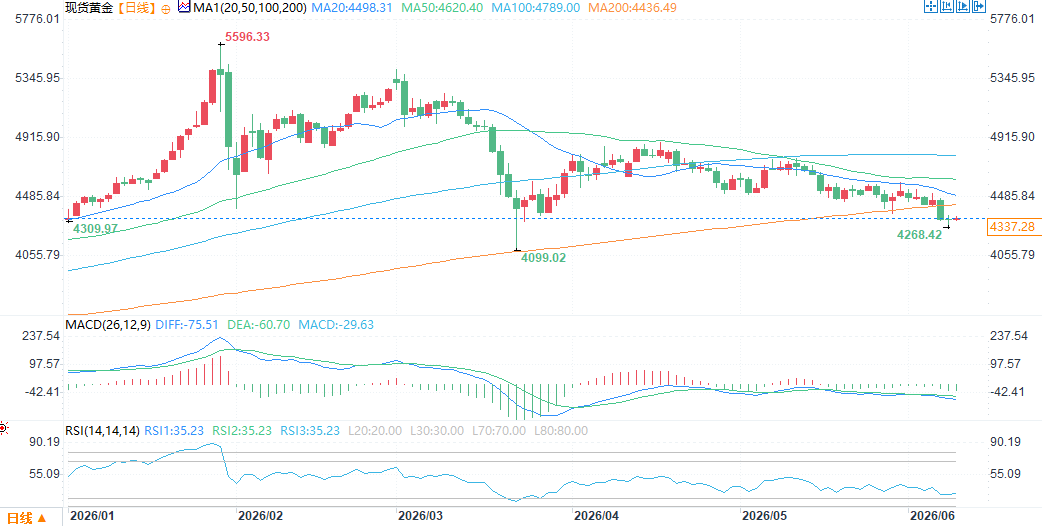
(Spot gold daily chart, source: FX678)
At 15:20 Beijing time on June 9, spot gold was trading at $4330.13 per ounce.
Gold has faced strong pressure in recent weeks, with the pullback gradually building momentum since peaking at the end of January.
The overall outlook for gold is becoming increasingly challenging. Soaring global bond yields, a resilient US economy, and a stronger dollar are collectively diminishing the appeal of gold as a non-interest-bearing asset. While structural support for gold remains in the long term, the short-term outlook has turned bearish.
The long-term bullish logic remains unchanged, but short-term pressures have intensified.
In the long term, the structural factors supporting gold's rise remain unchanged. Continued concerns about fiscal deficits, global central bank reserve diversification, and inflation risks should continue to provide support during significant gold price corrections.
However, the balance of risks appears poised to weaken further in the coming weeks before a more sustained recovery emerges.
Gold prices have weakened somewhat recently due to a market reassessment of the outlook for U.S. interest rates. Recent economic data has generally exceeded expectations, reinforcing the view that the Federal Reserve is more likely to tighten than ease policy later this year.
Stronger-than-expected labor market data released last Friday confirmed this view, pushing up US Treasury yields and supporting the dollar. This combination is unfavorable for gold, and recent price movements reflect this dynamic.
US CPI data will be key in the short term.
Market attention has now shifted to the upcoming US inflation data, which could play a decisive role in the short-term market direction.
Wednesday's May CPI report is the most crucial economic event of the week, with economists generally expecting overall inflation to rise to 4.2% year-on-year, a more than three-year high.
If inflation readings remain firm, it will confirm recent concerns from Federal Reserve Chairman Warsh and other officials about lingering price pressures, reinforcing market expectations that interest rates will remain high for an extended period. This could provide further support for the dollar while putting downward pressure on prices of precious metals such as gold. Conversely, if inflation unexpectedly weakens, it could reverse recent hawkish pricing, providing some breathing room for gold.
Meanwhile, developments in the energy market remain crucial. Despite the ceasefire announced by Iran and Israel, shipping through the Strait of Hormuz remains severely restricted, and crude oil prices are holding above $90. Continued disruptions to global supply chains will make it difficult for inflation concerns to dissipate quickly, thus limiting the upside potential for gold. The market will be closely watching inflation data and further developments in the Middle East situation.
The stock rebounded after the first three tests; can it hold this time?
Perhaps the most significant technical development is that gold has fallen below its 200-day moving average. The last time gold closed below this closely watched indicator was in September 2023, when that drop led to a roughly 5% decline in the following ten to eleven trading days before buyers returned and pushed prices back above the moving average in mid-October.
Since then, gold has tested the 200-day moving average three more times: the first time in November 2023 and the second time in March of this year. Both tests triggered significant rebounds, reinforcing the importance of this level as a long-term support area.
Gold prices have now fallen below this moving average, signaling a potential significant shift in market behavior. Technical traders typically view such moves as confirmation of a weakening long-term trend, which could encourage renewed selling pressure during short-term rallies.
Can gold avoid falling to $4,000?
Gold prices failed to hold above $4,500, ultimately making the market vulnerable to a deeper correction, and the break below the 200-day moving average accelerated the downward momentum.
The next major support zone for spot gold is a long-term uptrend line around $4,230. Below this, support levels become sparse until around the March low of $4,100, which could create room for a more significant decline if bears maintain control. Given the current market structure, a move towards the psychologically important $4,000 level cannot be ruled out.
On the upside, initial resistance is around $4366, followed by $4400, $4455, and the previous key resistance level of $4500. A rebound above these levels would help stabilize market sentiment, but a more substantial improvement in the outlook would require a decisive break above the broader resistance zone around $4580.
(Spot gold daily chart, source: FX678)
At 15:20 Beijing time on June 9, spot gold was trading at $4330.13 per ounce.
- Risk Warning and Disclaimer
- The market involves risk, and trading may not be suitable for all investors. This article is for reference only and does not constitute personal investment advice, nor does it take into account certain users’ specific investment objectives, financial situation, or other needs. Any investment decisions made based on this information are at your own risk.