Subtle changes are taking place in Japanese government bonds; what does this mean for the yen?
2026-06-09 20:02:41
On Tuesday (June 9), the USD/JPY pair remained around 160.100, precisely at the middle band of the 4-hour Bollinger Bands. Market sentiment was simultaneously pulled by two factors: The US non-farm payrolls data for May showed strong growth for the third consecutive month, fully absorbing the expectation that Fed Chairman Warsh's first meeting would leave interest rates unchanged, and significantly increasing the probability of another rate hike before the end of the year; On the same day, Japanese government bonds showed a cautionary technical signal – yields on 5-year to 30-year bonds all closed with a bearish outside pattern , meaning that after reaching new highs during the session, they gave back all gains and closed below the previous day's low. This combination created a rare resonance between yield spread expectations and the technical pattern of Japanese government bonds, rapidly escalating the battle between bulls and bears around the 160 level.
The bearish outcrop pattern on the daily chart for Japanese government bonds suggests that while the upward trend in long-term interest rates remains unchanged, short-term upward momentum has been significantly curbed. The 2-year JGB yield remains capped at 1.425%, with 1.46% and 1.50% forming resistance levels above. The 5-year yield touched 1.96% intraday before falling back to 1.925%, with the 2.00% level and the May 18 high of 2.05% acting as resistance. Resistance for the 10-year yield lies at the 2.76% gap and the May high of 2.81%, with a sharp 2.57% retracement level seen last week. The 30-year yield encountered resistance before reaching its historical high of 3.97%. If JGB yields consolidate or even pull back at this level, theoretically, it would temporarily alleviate interest rate differential pressure on the yen. However, with the yen still trading above 160, market interpretation is much more complex.
This is because the boundaries of official intervention are looming. Japan deployed a record 11.7 trillion yen in defense after the yen first broke through 160 on April 30th. On Tuesday, the exchange rate fell back into this sensitive area, but this time some market participants began to question the effectiveness of simple intervention. Some economists pointed out that, considering the one-year forward policy rate differential between the US and Japan, this gap is expected to widen further, and currency intervention based on this fundamental factor may have limited effectiveness at this time. The real variable that can change the situation returns to the Bank of Japan's policy communication.
From a macroeconomic perspective, US labor market data reinforced expectations of "interest rates remaining at higher levels for a longer period" or even "further tightening," directly limiting the potential for the yen to strengthen due to the Fed's dovish turn. A chief fund manager at a well-known asset management firm bluntly stated, "Strong US labor market data has increased pressure on the Bank of Japan to raise interest rates." Previously, the market had optimistically believed that US Treasury yields might decline, thus boosting the yen; this logic has now been reversed. The head of Japan economics at Oxford Economics went further, characterizing the upcoming rate hike as a "defensive measure aimed at preventing further yen depreciation," and emphasizing that the focus of the meeting was how the Bank of Japan would communicate its future rate hike path. This indicates that even though the swap market has already assigned a 93% probability to a 25 basis point rate hike to 1% at the June 15-16 meeting, and the probability of another rate hike to 1.25% before December has risen to 92.5%, the market's core focus is no longer on the individual action itself, but rather on whether the central bank will adopt a more hawkish tone due to exchange rate pressure.
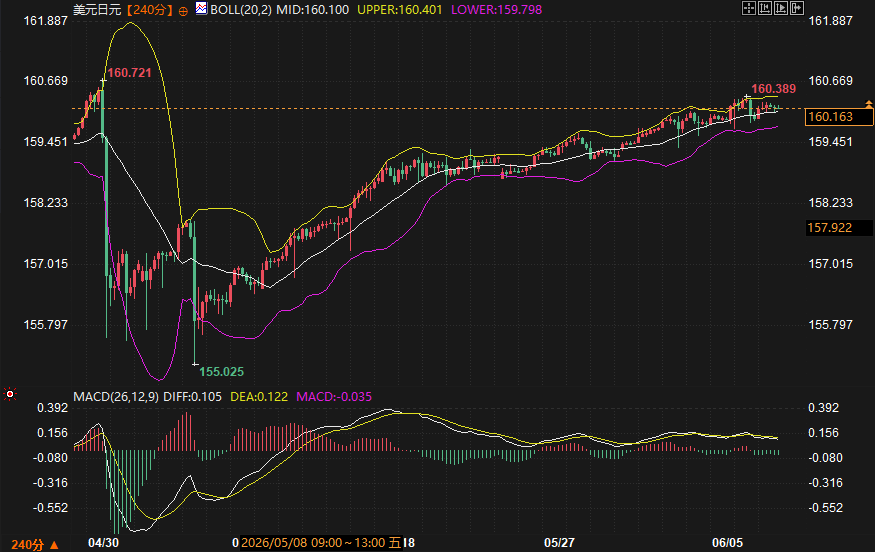
From a technical perspective, the 4-hour chart for USD/JPY clearly shows the traces left by the game of policy expectations. Referring to the USD/JPY contract, the price has rebounded more than 500 points from the low of 155.025, forming a secondary high at 160.389. It failed to directly challenge the previous high of 160.721 and subsequently entered a period of consolidation at higher levels. The Bollinger Bands (20,2) are narrowing, with the upper band at 160.401, the middle band at 160.100, and the lower band at 159.798, suggesting that volatility has somewhat converged. The MACD is in a death cross state, with the DIFF at 0.105 below the DEA at 0.122, and the green momentum bars persisting, indicating that the short-term downward momentum has not yet been fully released, but the price has temporarily found equilibrium at the middle Bollinger Band. Therefore, the support and resistance range can be determined as follows: the initial resistance is at the upper Bollinger Band at 160.401, and a break above this level would target the recent high of 160.389 and the key resistance at 160.721. On the downside, a break below the middle Bollinger Band at 160.100 would target the lower Bollinger Band at 159.798, with further support at 157.922. The underlying logic is that as long as the price holds above the middle Bollinger Band, the bullish structure remains intact. Conversely, if Japanese government bond yields rise again, coupled with hawkish signals from the Federal Reserve, the exchange rate may advance towards the 160.40-160.72 area, supported by the middle Bollinger Band. However, if the pullback in Japanese government bond yields deepens and expectations of intervention intensify, the hold of the 160.100 support level becomes crucial.
In the short term, USD/JPY is likely to digest multiple contradictions within the 159.80 to 160.70 range. Ahead of the Bank of Japan's meeting next week, any reports suggesting a possible acceleration of interest rate hikes or hints of multiple actions this year could catalyze a downward test of the 159.80 level. Conversely, if Federal Reserve officials further confirm the prospect of a year-end rate hike, and Japanese government bond yields fail to mount a significant rebound after outside the daily chart pattern, the expected interest rate differential will continue to support the exchange rate's upward test of the previous high of 160.72. Intraday trading should closely monitor the reaction of the 10-year Japanese government bond yield at the 2.76% gap, as well as public comments from Japanese Ministry of Finance officials. What will truly break the current balance will be the subtle changes in the Bank of Japan's wording regarding the future interest rate path in its meeting statement. This will directly determine whether intervention and expectations of rate hikes can work together to push the yen out of its passive position.
What impact will the bear market outcropping pattern in Japanese government bond yields have on the yen?
The bearish engulfing pattern on the daily chart indicates that after hitting a new intraday high, the Japanese government bond yield actually fell below the previous day's low at the close, suggesting that the short-term upward movement of long-term interest rates encountered strong resistance. This pattern often foreshadows a potential consolidation or pullback in yields at high levels, temporarily narrowing the room for a further significant widening of the USD/JPY interest rate differential and providing short-term support for the yen. However, it's crucial to note that if this pattern fails to evolve into a trend reversal and is merely a high-level turnover, the yen's support will be very limited, and the exchange rate will quickly revert to weakening in line with interest rate differential expectations.
Given the extremely high probability of the Bank of Japan raising interest rates this month, why is the market still paying close attention to its communication stance?
Currently, the swap market has priced in a 25 basis point rate hike to 1% in June by as much as 93%, meaning that the boost to the yen from the rate hike decision itself has already been priced in. What the market really wants to know from the central bank meeting is whether the future rate hike path will become steeper due to exchange rate pressure. The head of Japan economics at Oxford Economics views this rate hike as a defensive measure; only if the Bank of Japan's statement conveys an openness or even urgency towards further rate hikes will it trigger a repricing of yen short positions; a more dovish tone could put further pressure on the yen.
Japan intervened on a large scale above 160, so why has the market become more skeptical of the effectiveness of the intervention?
Japan's Ministry of Finance intervened in the market with 11.7 trillion yen in April and May, but the yen subsequently rebounded above 160. Some economists point out that based on expectations of a widening spread in the one-year forward policy interest rate between the US and Japan, the current exchange rate movement is still mainly driven by interest rate differentials. Simply selling dollars and buying yen is unlikely to reverse the trend unless it can be combined with monetary tightening policies. Therefore, some market observers believe that the intervention is more about smoothing out the speed of fluctuations than changing the direction.
From a technical perspective, what are the key support and resistance levels currently facing the USD/JPY pair?
Using the 4-hour chart for USD/JPY, the current price is consolidating around the Bollinger Band middle line at 160.100. Resistance levels are as follows: the upper Bollinger Band at 160.401, the recent high at 160.389, and the key resistance level at 160.721. Support is initially seen at the 160.100 middle Bollinger Band; a break below this level would test the 159.798 lower Bollinger Band, followed by support around 157.922. The MACD death cross indicates that short-term bearish momentum remains, but as long as the price stays above the middle Bollinger Band, the overall rebound structure remains intact.
How exactly do changes in the Federal Reserve's policy expectations translate into the USD/JPY exchange rate?
Strong US non-farm payrolls have led the market to reprice the Federal Reserve's next policy move as a possible rate hike by the end of the year, rather than a rate cut. This expectation has boosted US Treasury yields, widened the US-Japan policy interest rate differential, directly increased the attractiveness of dollar assets, and driven the USD/JPY exchange rate higher. At the same time, it shattered the previous expectation of yen bulls that "declining US Treasury yields would push up the yen," instead increasing the pressure on the Bank of Japan to adopt a more hawkish stance in response to depreciation. This creates a dual pull from the fundamentals, ultimately transmitting to the exchange rate through real demand and speculative capital flows.
The bearish outcrop pattern on the daily chart for Japanese government bonds suggests that while the upward trend in long-term interest rates remains unchanged, short-term upward momentum has been significantly curbed. The 2-year JGB yield remains capped at 1.425%, with 1.46% and 1.50% forming resistance levels above. The 5-year yield touched 1.96% intraday before falling back to 1.925%, with the 2.00% level and the May 18 high of 2.05% acting as resistance. Resistance for the 10-year yield lies at the 2.76% gap and the May high of 2.81%, with a sharp 2.57% retracement level seen last week. The 30-year yield encountered resistance before reaching its historical high of 3.97%. If JGB yields consolidate or even pull back at this level, theoretically, it would temporarily alleviate interest rate differential pressure on the yen. However, with the yen still trading above 160, market interpretation is much more complex.
This is because the boundaries of official intervention are looming. Japan deployed a record 11.7 trillion yen in defense after the yen first broke through 160 on April 30th. On Tuesday, the exchange rate fell back into this sensitive area, but this time some market participants began to question the effectiveness of simple intervention. Some economists pointed out that, considering the one-year forward policy rate differential between the US and Japan, this gap is expected to widen further, and currency intervention based on this fundamental factor may have limited effectiveness at this time. The real variable that can change the situation returns to the Bank of Japan's policy communication.
Fundamental and policy logic deduced from technical analysis
From a macroeconomic perspective, US labor market data reinforced expectations of "interest rates remaining at higher levels for a longer period" or even "further tightening," directly limiting the potential for the yen to strengthen due to the Fed's dovish turn. A chief fund manager at a well-known asset management firm bluntly stated, "Strong US labor market data has increased pressure on the Bank of Japan to raise interest rates." Previously, the market had optimistically believed that US Treasury yields might decline, thus boosting the yen; this logic has now been reversed. The head of Japan economics at Oxford Economics went further, characterizing the upcoming rate hike as a "defensive measure aimed at preventing further yen depreciation," and emphasizing that the focus of the meeting was how the Bank of Japan would communicate its future rate hike path. This indicates that even though the swap market has already assigned a 93% probability to a 25 basis point rate hike to 1% at the June 15-16 meeting, and the probability of another rate hike to 1.25% before December has risen to 92.5%, the market's core focus is no longer on the individual action itself, but rather on whether the central bank will adopt a more hawkish tone due to exchange rate pressure.
From a technical perspective, the 4-hour chart for USD/JPY clearly shows the traces left by the game of policy expectations. Referring to the USD/JPY contract, the price has rebounded more than 500 points from the low of 155.025, forming a secondary high at 160.389. It failed to directly challenge the previous high of 160.721 and subsequently entered a period of consolidation at higher levels. The Bollinger Bands (20,2) are narrowing, with the upper band at 160.401, the middle band at 160.100, and the lower band at 159.798, suggesting that volatility has somewhat converged. The MACD is in a death cross state, with the DIFF at 0.105 below the DEA at 0.122, and the green momentum bars persisting, indicating that the short-term downward momentum has not yet been fully released, but the price has temporarily found equilibrium at the middle Bollinger Band. Therefore, the support and resistance range can be determined as follows: the initial resistance is at the upper Bollinger Band at 160.401, and a break above this level would target the recent high of 160.389 and the key resistance at 160.721. On the downside, a break below the middle Bollinger Band at 160.100 would target the lower Bollinger Band at 159.798, with further support at 157.922. The underlying logic is that as long as the price holds above the middle Bollinger Band, the bullish structure remains intact. Conversely, if Japanese government bond yields rise again, coupled with hawkish signals from the Federal Reserve, the exchange rate may advance towards the 160.40-160.72 area, supported by the middle Bollinger Band. However, if the pullback in Japanese government bond yields deepens and expectations of intervention intensify, the hold of the 160.100 support level becomes crucial.
Market Outlook
In the short term, USD/JPY is likely to digest multiple contradictions within the 159.80 to 160.70 range. Ahead of the Bank of Japan's meeting next week, any reports suggesting a possible acceleration of interest rate hikes or hints of multiple actions this year could catalyze a downward test of the 159.80 level. Conversely, if Federal Reserve officials further confirm the prospect of a year-end rate hike, and Japanese government bond yields fail to mount a significant rebound after outside the daily chart pattern, the expected interest rate differential will continue to support the exchange rate's upward test of the previous high of 160.72. Intraday trading should closely monitor the reaction of the 10-year Japanese government bond yield at the 2.76% gap, as well as public comments from Japanese Ministry of Finance officials. What will truly break the current balance will be the subtle changes in the Bank of Japan's wording regarding the future interest rate path in its meeting statement. This will directly determine whether intervention and expectations of rate hikes can work together to push the yen out of its passive position.
Frequently Asked Questions
What impact will the bear market outcropping pattern in Japanese government bond yields have on the yen?
The bearish engulfing pattern on the daily chart indicates that after hitting a new intraday high, the Japanese government bond yield actually fell below the previous day's low at the close, suggesting that the short-term upward movement of long-term interest rates encountered strong resistance. This pattern often foreshadows a potential consolidation or pullback in yields at high levels, temporarily narrowing the room for a further significant widening of the USD/JPY interest rate differential and providing short-term support for the yen. However, it's crucial to note that if this pattern fails to evolve into a trend reversal and is merely a high-level turnover, the yen's support will be very limited, and the exchange rate will quickly revert to weakening in line with interest rate differential expectations.
Given the extremely high probability of the Bank of Japan raising interest rates this month, why is the market still paying close attention to its communication stance?
Currently, the swap market has priced in a 25 basis point rate hike to 1% in June by as much as 93%, meaning that the boost to the yen from the rate hike decision itself has already been priced in. What the market really wants to know from the central bank meeting is whether the future rate hike path will become steeper due to exchange rate pressure. The head of Japan economics at Oxford Economics views this rate hike as a defensive measure; only if the Bank of Japan's statement conveys an openness or even urgency towards further rate hikes will it trigger a repricing of yen short positions; a more dovish tone could put further pressure on the yen.
Japan intervened on a large scale above 160, so why has the market become more skeptical of the effectiveness of the intervention?
Japan's Ministry of Finance intervened in the market with 11.7 trillion yen in April and May, but the yen subsequently rebounded above 160. Some economists point out that based on expectations of a widening spread in the one-year forward policy interest rate between the US and Japan, the current exchange rate movement is still mainly driven by interest rate differentials. Simply selling dollars and buying yen is unlikely to reverse the trend unless it can be combined with monetary tightening policies. Therefore, some market observers believe that the intervention is more about smoothing out the speed of fluctuations than changing the direction.
From a technical perspective, what are the key support and resistance levels currently facing the USD/JPY pair?
Using the 4-hour chart for USD/JPY, the current price is consolidating around the Bollinger Band middle line at 160.100. Resistance levels are as follows: the upper Bollinger Band at 160.401, the recent high at 160.389, and the key resistance level at 160.721. Support is initially seen at the 160.100 middle Bollinger Band; a break below this level would test the 159.798 lower Bollinger Band, followed by support around 157.922. The MACD death cross indicates that short-term bearish momentum remains, but as long as the price stays above the middle Bollinger Band, the overall rebound structure remains intact.
How exactly do changes in the Federal Reserve's policy expectations translate into the USD/JPY exchange rate?
Strong US non-farm payrolls have led the market to reprice the Federal Reserve's next policy move as a possible rate hike by the end of the year, rather than a rate cut. This expectation has boosted US Treasury yields, widened the US-Japan policy interest rate differential, directly increased the attractiveness of dollar assets, and driven the USD/JPY exchange rate higher. At the same time, it shattered the previous expectation of yen bulls that "declining US Treasury yields would push up the yen," instead increasing the pressure on the Bank of Japan to adopt a more hawkish stance in response to depreciation. This creates a dual pull from the fundamentals, ultimately transmitting to the exchange rate through real demand and speculative capital flows.
- Risk Warning and Disclaimer
- The market involves risk, and trading may not be suitable for all investors. This article is for reference only and does not constitute personal investment advice, nor does it take into account certain users’ specific investment objectives, financial situation, or other needs. Any investment decisions made based on this information are at your own risk.