The strongest warning for gold since 2023 has been sounded; is the trend dead?
2026-06-09 20:29:21
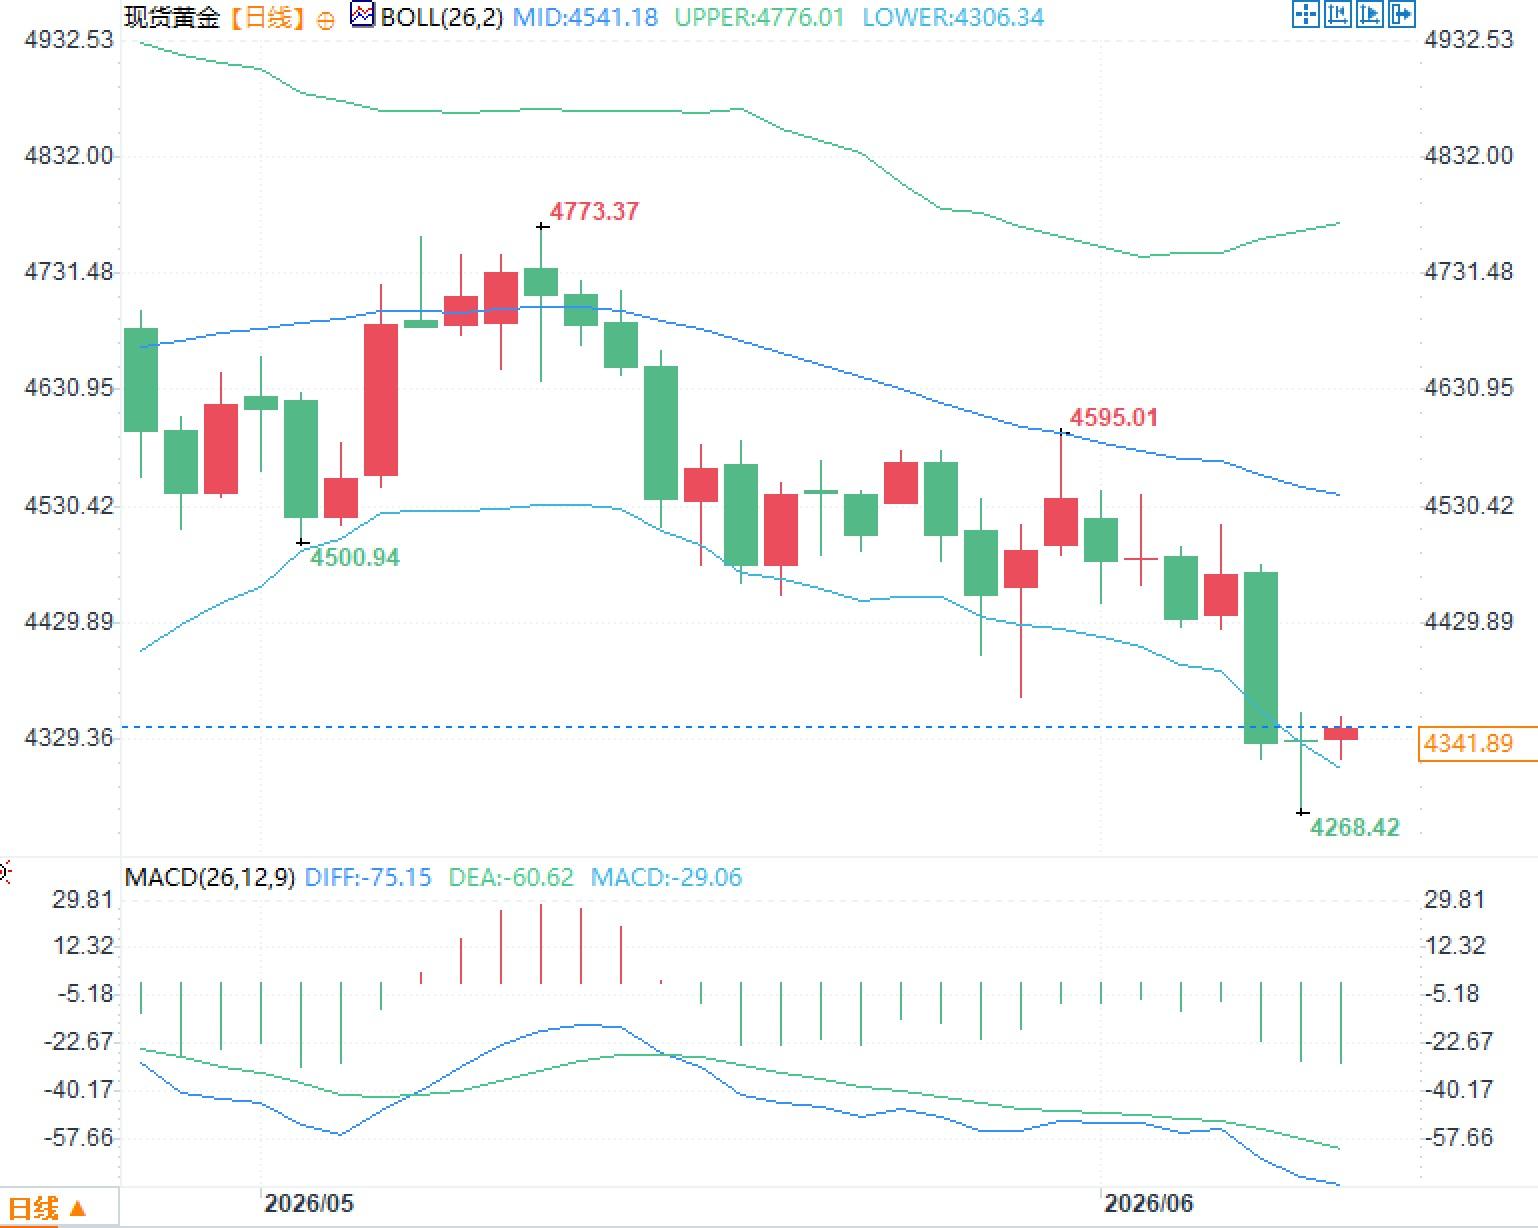
On Tuesday, June 9th, spot gold entered a period of consolidation after a sharp decline, currently trading around $4340 per ounce. The previous trading day saw a dip to $4268.42 per ounce. The Bollinger Band middle line is at $4541.18 per ounce, and the lower line is at $4306.34 per ounce; the price is close to the lower line area. Gold prices fluctuated slightly throughout the day, with limited change from the previous trading day. While the price has fallen by more than 8% over the past month, the pressure from the year-to-date highs has not yet been fully digested.
The core of this round of gold price adjustments is not simply a decline in safe-haven demand, but rather a simultaneous revaluation of both the safe-haven premium and interest rate pricing. Following signs of easing tensions in the Middle East, oil prices gave back some of their gains, with Brent crude falling to around $92.70 per barrel and West Texas Intermediate crude falling to around $89.50 per barrel, indicating a slight easing of immediate inflationary pressures from the energy sector. Trump stated that the arrangements were in the "final stages" and indicated that initial clues might emerge within a day or two, but both Israel and Iran reserved room for maneuver, suggesting that the risk premium has only contracted, not completely disappeared.
For gold, a de-escalation of conflict is not necessarily bearish; the key lies in how the market reprices inflation and interest rates. If oil prices fall from their highs, a marginal cooling of inflation expectations will weaken safe-haven buying. However, if inflation remains high, expectations that the Federal Reserve will maintain a tight policy will increase the opportunity cost of holding gold. The current contradiction in gold prices lies here: geopolitical risks have not completely subsided, but interest rate pressures have become a more direct pricing factor.
U.S. nonfarm payrolls increased by 172,000 in May, with the unemployment rate remaining at 4.3%. The employment data exceeded market expectations, weakening the basis for previous trading regarding interest rate cuts. The official employment report also showed that job growth was primarily driven by the leisure and hospitality, local government, and healthcare sectors, while employment in financial activity declined. Interest rate futures pricing indicates that the probability of a December rate hike has risen to over 70%, a significant increase from the previous week.
The downward pressure on gold prices stems from two sources. First, the stronger-than-expected employment data reduces the need for the Federal Reserve to shift towards a more accommodative stance in the short term. Second, the market is beginning to reassess inflation stickiness, especially given that energy prices remain high and supply chain disruptions have not been fully resolved. The May Consumer Price Index will be released on June 10th, the May Producer Price Index on June 11th, and the Federal Reserve will hold its policy meeting on June 16th and 17th.
For gold, a non-interest-bearing asset, upward revisions to interest rate expectations tend to be more persistent than simple fluctuations in the US dollar. The rise in 2-year and 10-year US Treasury yields following the employment data reflects that the market has already re-incorporated the risk of policy tightening into prices. Unless inflation data shows a significant easing, even if gold receives safe-haven support, it is likely to encounter constraints from real interest rates during any rebound.
On the daily chart, spot gold has broken below the 200-day moving average, a key signal that has not appeared since October 2023. Technical trading systems typically view the 200-day moving average as a medium-term trend dividing line. Once the price continues to trade below this line, trend-following funds will reduce their confidence in the continuation of any rebound, and short-term corrections are more likely to be interpreted as stress tests rather than trend reversals.
Looking at the chart, the lower Bollinger Band is currently around $4306.34/oz. Gold prices briefly fell to $4268.42/oz yesterday, indicating that this lower support level was briefly breached. In the MACD indicator, the DIFF is -75.15 and the DEA is -60.62, with the histogram still in negative territory, suggesting the trend momentum has not yet fully recovered. The short-term price return to around $4340/oz only indicates that selling pressure after the sharp drop has eased; it does not directly prove that funds are re-establishing a trend premium.
More importantly, the $4,500/ounce level has transformed from previous support into resistance. If inflation data continues to exceed market tolerance, real interest rate expectations may continue to suppress gold's valuation. If the data falls short of expectations, gold's potential for recovery will first face scrutiny from the 200-day moving average, the Bollinger middle band, and the previous area of dense trading.
Question 1: What does it mean if the 200-day moving average is breached?
A: This usually means that the medium-term trend signal is weakening, and trend funds will be more cautious. A short-term rebound needs to regain a foothold above the key moving average to be more convincing.
Question 2: What is the most important variable in the market going forward?
A: The focus is on the May inflation data and the June Fed meeting. If inflation remains sticky, interest rate pressures will continue to suppress gold valuations. Only if inflation eases significantly will gold prices have the potential to recover.
Geopolitical cooling compresses safe-haven premium, shifting the support logic for gold.
The core of this round of gold price adjustments is not simply a decline in safe-haven demand, but rather a simultaneous revaluation of both the safe-haven premium and interest rate pricing. Following signs of easing tensions in the Middle East, oil prices gave back some of their gains, with Brent crude falling to around $92.70 per barrel and West Texas Intermediate crude falling to around $89.50 per barrel, indicating a slight easing of immediate inflationary pressures from the energy sector. Trump stated that the arrangements were in the "final stages" and indicated that initial clues might emerge within a day or two, but both Israel and Iran reserved room for maneuver, suggesting that the risk premium has only contracted, not completely disappeared.
For gold, a de-escalation of conflict is not necessarily bearish; the key lies in how the market reprices inflation and interest rates. If oil prices fall from their highs, a marginal cooling of inflation expectations will weaken safe-haven buying. However, if inflation remains high, expectations that the Federal Reserve will maintain a tight policy will increase the opportunity cost of holding gold. The current contradiction in gold prices lies here: geopolitical risks have not completely subsided, but interest rate pressures have become a more direct pricing factor.
Interest rate expectations become the dominant variable, and non-farm payroll data changes the short-term narrative.
U.S. nonfarm payrolls increased by 172,000 in May, with the unemployment rate remaining at 4.3%. The employment data exceeded market expectations, weakening the basis for previous trading regarding interest rate cuts. The official employment report also showed that job growth was primarily driven by the leisure and hospitality, local government, and healthcare sectors, while employment in financial activity declined. Interest rate futures pricing indicates that the probability of a December rate hike has risen to over 70%, a significant increase from the previous week.
The downward pressure on gold prices stems from two sources. First, the stronger-than-expected employment data reduces the need for the Federal Reserve to shift towards a more accommodative stance in the short term. Second, the market is beginning to reassess inflation stickiness, especially given that energy prices remain high and supply chain disruptions have not been fully resolved. The May Consumer Price Index will be released on June 10th, the May Producer Price Index on June 11th, and the Federal Reserve will hold its policy meeting on June 16th and 17th.
For gold, a non-interest-bearing asset, upward revisions to interest rate expectations tend to be more persistent than simple fluctuations in the US dollar. The rise in 2-year and 10-year US Treasury yields following the employment data reflects that the market has already re-incorporated the risk of policy tightening into prices. Unless inflation data shows a significant easing, even if gold receives safe-haven support, it is likely to encounter constraints from real interest rates during any rebound.
The technical structure has weakened, and the market implications of breaking below the 200-day moving average are as follows:
On the daily chart, spot gold has broken below the 200-day moving average, a key signal that has not appeared since October 2023. Technical trading systems typically view the 200-day moving average as a medium-term trend dividing line. Once the price continues to trade below this line, trend-following funds will reduce their confidence in the continuation of any rebound, and short-term corrections are more likely to be interpreted as stress tests rather than trend reversals.
Looking at the chart, the lower Bollinger Band is currently around $4306.34/oz. Gold prices briefly fell to $4268.42/oz yesterday, indicating that this lower support level was briefly breached. In the MACD indicator, the DIFF is -75.15 and the DEA is -60.62, with the histogram still in negative territory, suggesting the trend momentum has not yet fully recovered. The short-term price return to around $4340/oz only indicates that selling pressure after the sharp drop has eased; it does not directly prove that funds are re-establishing a trend premium.
More importantly, the $4,500/ounce level has transformed from previous support into resistance. If inflation data continues to exceed market tolerance, real interest rate expectations may continue to suppress gold's valuation. If the data falls short of expectations, gold's potential for recovery will first face scrutiny from the 200-day moving average, the Bollinger middle band, and the previous area of dense trading.
Frequently Asked Questions
Question 1: What does it mean if the 200-day moving average is breached?
A: This usually means that the medium-term trend signal is weakening, and trend funds will be more cautious. A short-term rebound needs to regain a foothold above the key moving average to be more convincing.
Question 2: What is the most important variable in the market going forward?
A: The focus is on the May inflation data and the June Fed meeting. If inflation remains sticky, interest rate pressures will continue to suppress gold valuations. Only if inflation eases significantly will gold prices have the potential to recover.
- Risk Warning and Disclaimer
- The market involves risk, and trading may not be suitable for all investors. This article is for reference only and does not constitute personal investment advice, nor does it take into account certain users’ specific investment objectives, financial situation, or other needs. Any investment decisions made based on this information are at your own risk.