Is the Fed pricing in its rate hike ahead of schedule? The "wedge" pattern in the 2-year US Treasury yield is brewing a key correction.
2026-06-09 20:36:48
On Tuesday (June 9), the overnight US Treasury market continued its recent high-level tug-of-war, with the 10-year yield hovering around 4.543% and the 2-year yield trading at 4.136%. The core logic of the market is clear, but internal contradictions are intensifying: the stronger-than-expected resilience of May's non-farm payrolls has essentially ruled out the possibility of a short-term rate cut, pushing the Fed's policy expectations firmly into the rate hike quadrant. Meanwhile, the situation in the Middle East continues to inject a risk premium into oil prices. Although Trump has called for an immediate ceasefire, the market is more focused on the increasingly distorted correlation between oil prices and US Treasury bonds. The current market situation is no longer a simple narrative of safe-haven demand and inflation, but a deep game concerning the solidification of inflation expectations and the pricing of monetary tightening .

From a macroeconomic perspective, last week's May jobs report completely reshaped market betting. In recent months, a strong labor market has deprived the Federal Reserve of any justification for rate cuts, and several major banks have reversed their forecasts, beginning to price in rate hikes for the second half of the year. Market interest rate pricing now implies a near 75% probability of a rate hike, even incorporating a tightening of more than 25 basis points. This shift has resulted in a significantly asymmetric response of US Treasury yields to oil price fluctuations.
Currently, the correlation between oil prices and yields is heavily biased towards the bears. The prevailing market view is that, given a stable labor market and inflation remaining above target, persistently high oil prices will quickly and almost proportionally translate into higher long-term yields. The logic is that investors will interpret high oil prices as a signal of inflation expectations decoupling, thus reinforcing their pricing of tightening policies. Conversely, even if geopolitical premiums subside and oil prices fall in the future, the decline in yields will be quite limited. This is because a single drop in energy prices is unlikely to substantially change the Federal Reserve's tightening policy path. If subsequent inflation data exceeds expectations, the market may even interpret the previous energy cost transmission as broader price pressure, completely blocking the window for yield declines.
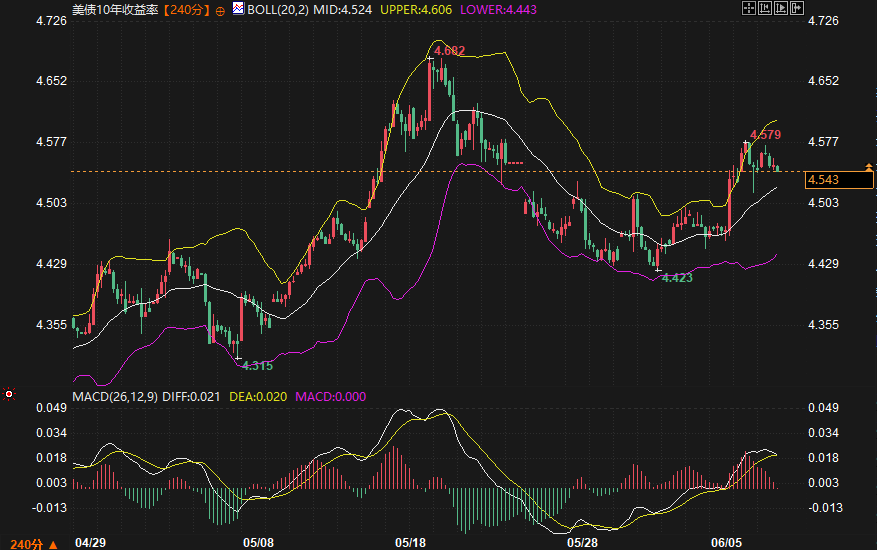
Turning our attention to the technical charts, the market signals also show a tug-of-war. Looking at the 240-minute chart of the 10-year US Treasury yield , after a V-shaped reversal from the 4.315% low, the price has been trading above the Bollinger Band middle line (4.524%), exhibiting a slightly bullish consolidation pattern. Currently, the MACD indicator's DIFF and DEA lines are almost converging, with the histogram near the zero line, at the critical point of a golden cross or death cross, suggesting a small-scale trend is building momentum. The immediate resistance is near the upper Bollinger Band at 4.606% , and a successful break above this level would challenge the previous high of 4.682% .
In contrast, the situation regarding the 2-year US Treasury yield is more nuanced. After rebounding from a low of 3.825%, the price is currently consolidating around the Bollinger Band's middle line (4.120%). Although the MACD shows a death cross, the green bars have narrowed significantly, indicating weakening downward momentum. In the short term, it is highly likely to fluctuate and correct within the 4.004% to 4.236% range. However, on a larger timeframe, the daily chart, technical analysts have clearly pointed out that the 2-year yield is forming a rising wedge pattern with both highs and lows, and the Relative Strength Index (RSI) has shown a bearish divergence. Once this pattern is confirmed to break downwards, it could open up correction potential towards the 3.65% to 3.75% area.
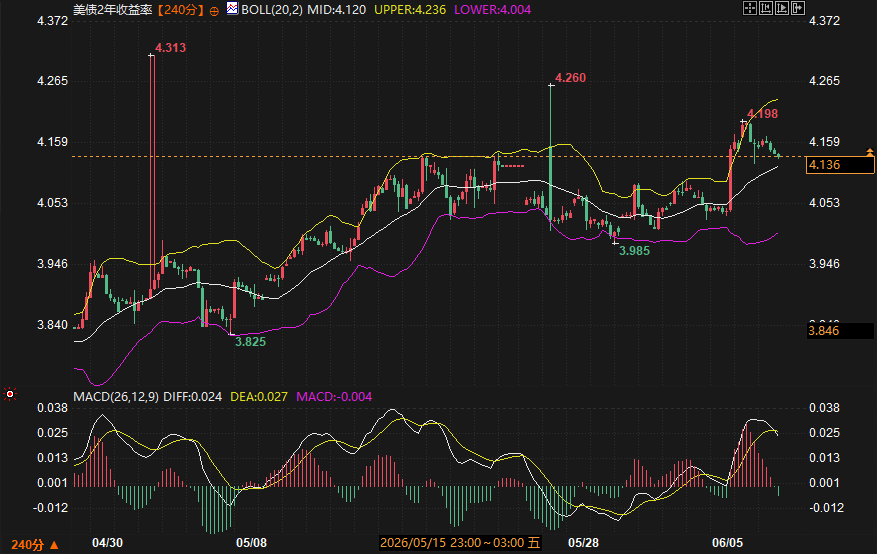
Referring to spot yields, key points to observe within specific ranges are as follows: For the 10-year US Treasury yield, support is seen at the lower bound of 4.443%, with stronger support at 4.315%; resistance is seen at 4.606%, followed by 4.682%. For the 2-year US Treasury yield, support lies at 4.004% and the recent low of 3.825%, while resistance is in the 4.236% to 4.313% range. During trading, close attention should be paid to the auction demand for 3-year new bonds and the NFIB Small Business Optimism Index to verify the market's willingness to absorb high yields.
In summary, with persistent inflation and wage stickiness in the service sector and the Iranian stalemate potentially continuing into the fall, supply-side risks from oil prices remain the primary concern. This makes it unlikely that US Treasury yields will decline significantly in the near term; maintaining high levels and fluctuating strongly while seeking a breakout opportunity is the most probable path. However, technical divergences in some term structures and weakening RSI momentum warrant attention, suggesting that market pricing in Fed rate hikes may be overcrowded in the short term. Any subsequent economic data fluctuations could easily trigger a technical correction.
Why is it that the current drop in oil prices is failing to drive down US Treasury yields?
With the U.S. job market remaining tight and core inflation solid, the Federal Reserve's policy considerations have shifted from solely focusing on commodity prices to guarding against broader inflationary expectations. A decline in energy prices alone will not substantially change the committee's tightening stance; therefore, the market is unwilling to bet on lower yields based solely on falling oil prices, but is extremely sensitive to rising energy prices.
What does the prolonged stalemate in the Iranian conflict mean for the market?
The current protracted standoff means that shipping risks in the Strait of Hormuz remain at a premium. According to JPMorgan Chase's assessment, a substantial blockade could push OECD crude oil inventories to operational warning levels within weeks, and the risk of Brent crude prices being pushed to the $120-$130 range would trigger a new round of strong energy-driven inflation.
Is the rising wedge pattern forming on the 2-year yield chart a bearish signal?
Wedge patterns typically have a bearish bias, indicating a directional shift after momentum exhaustion. However, given that fundamentals support tight pricing, this is more likely to represent a period of consolidation at higher levels. Only a decisive break below the lower trendline of the wedge, such as a clear breach of the 4.00% Fibonacci retracement level, can confirm a weakening trend and a move towards lower support.
Has the market already over-priced in the Fed's interest rate hike?
Despite CME Group tools indicating a greater than 70% probability of tightening, current pricing remains reasonable given the strong May jobs report and the existing conflict between Trump's demands for rate cuts and the Fed's independent decision-making. If subsequent inflation data remain muted, the market may even be underestimating the actual extent of future tightening.
How will the strength of US Treasury yields be reflected in the foreign exchange market?
The widening nominal interest rate spread has provided substantial support for the US dollar index , especially exerting sustained downward pressure on interest rate differentials for low-interest currencies. However, given the current highly volatile environment of risk aversion and interest rate pricing, capital flows will become more complex. Close attention needs to be paid to the upcoming inflation indicators this week to determine the secondary transmission logic of real interest rate trends to the foreign exchange market.
A clash between fundamental and technical logic
From a macroeconomic perspective, last week's May jobs report completely reshaped market betting. In recent months, a strong labor market has deprived the Federal Reserve of any justification for rate cuts, and several major banks have reversed their forecasts, beginning to price in rate hikes for the second half of the year. Market interest rate pricing now implies a near 75% probability of a rate hike, even incorporating a tightening of more than 25 basis points. This shift has resulted in a significantly asymmetric response of US Treasury yields to oil price fluctuations.
Currently, the correlation between oil prices and yields is heavily biased towards the bears. The prevailing market view is that, given a stable labor market and inflation remaining above target, persistently high oil prices will quickly and almost proportionally translate into higher long-term yields. The logic is that investors will interpret high oil prices as a signal of inflation expectations decoupling, thus reinforcing their pricing of tightening policies. Conversely, even if geopolitical premiums subside and oil prices fall in the future, the decline in yields will be quite limited. This is because a single drop in energy prices is unlikely to substantially change the Federal Reserve's tightening policy path. If subsequent inflation data exceeds expectations, the market may even interpret the previous energy cost transmission as broader price pressure, completely blocking the window for yield declines.
Turning our attention to the technical charts, the market signals also show a tug-of-war. Looking at the 240-minute chart of the 10-year US Treasury yield , after a V-shaped reversal from the 4.315% low, the price has been trading above the Bollinger Band middle line (4.524%), exhibiting a slightly bullish consolidation pattern. Currently, the MACD indicator's DIFF and DEA lines are almost converging, with the histogram near the zero line, at the critical point of a golden cross or death cross, suggesting a small-scale trend is building momentum. The immediate resistance is near the upper Bollinger Band at 4.606% , and a successful break above this level would challenge the previous high of 4.682% .
In contrast, the situation regarding the 2-year US Treasury yield is more nuanced. After rebounding from a low of 3.825%, the price is currently consolidating around the Bollinger Band's middle line (4.120%). Although the MACD shows a death cross, the green bars have narrowed significantly, indicating weakening downward momentum. In the short term, it is highly likely to fluctuate and correct within the 4.004% to 4.236% range. However, on a larger timeframe, the daily chart, technical analysts have clearly pointed out that the 2-year yield is forming a rising wedge pattern with both highs and lows, and the Relative Strength Index (RSI) has shown a bearish divergence. Once this pattern is confirmed to break downwards, it could open up correction potential towards the 3.65% to 3.75% area.
Referring to spot yields, key points to observe within specific ranges are as follows: For the 10-year US Treasury yield, support is seen at the lower bound of 4.443%, with stronger support at 4.315%; resistance is seen at 4.606%, followed by 4.682%. For the 2-year US Treasury yield, support lies at 4.004% and the recent low of 3.825%, while resistance is in the 4.236% to 4.313% range. During trading, close attention should be paid to the auction demand for 3-year new bonds and the NFIB Small Business Optimism Index to verify the market's willingness to absorb high yields.
Future Trend Outlook
In summary, with persistent inflation and wage stickiness in the service sector and the Iranian stalemate potentially continuing into the fall, supply-side risks from oil prices remain the primary concern. This makes it unlikely that US Treasury yields will decline significantly in the near term; maintaining high levels and fluctuating strongly while seeking a breakout opportunity is the most probable path. However, technical divergences in some term structures and weakening RSI momentum warrant attention, suggesting that market pricing in Fed rate hikes may be overcrowded in the short term. Any subsequent economic data fluctuations could easily trigger a technical correction.
Frequently Asked Questions
Why is it that the current drop in oil prices is failing to drive down US Treasury yields?
With the U.S. job market remaining tight and core inflation solid, the Federal Reserve's policy considerations have shifted from solely focusing on commodity prices to guarding against broader inflationary expectations. A decline in energy prices alone will not substantially change the committee's tightening stance; therefore, the market is unwilling to bet on lower yields based solely on falling oil prices, but is extremely sensitive to rising energy prices.
What does the prolonged stalemate in the Iranian conflict mean for the market?
The current protracted standoff means that shipping risks in the Strait of Hormuz remain at a premium. According to JPMorgan Chase's assessment, a substantial blockade could push OECD crude oil inventories to operational warning levels within weeks, and the risk of Brent crude prices being pushed to the $120-$130 range would trigger a new round of strong energy-driven inflation.
Is the rising wedge pattern forming on the 2-year yield chart a bearish signal?
Wedge patterns typically have a bearish bias, indicating a directional shift after momentum exhaustion. However, given that fundamentals support tight pricing, this is more likely to represent a period of consolidation at higher levels. Only a decisive break below the lower trendline of the wedge, such as a clear breach of the 4.00% Fibonacci retracement level, can confirm a weakening trend and a move towards lower support.
Has the market already over-priced in the Fed's interest rate hike?
Despite CME Group tools indicating a greater than 70% probability of tightening, current pricing remains reasonable given the strong May jobs report and the existing conflict between Trump's demands for rate cuts and the Fed's independent decision-making. If subsequent inflation data remain muted, the market may even be underestimating the actual extent of future tightening.
How will the strength of US Treasury yields be reflected in the foreign exchange market?
The widening nominal interest rate spread has provided substantial support for the US dollar index , especially exerting sustained downward pressure on interest rate differentials for low-interest currencies. However, given the current highly volatile environment of risk aversion and interest rate pricing, capital flows will become more complex. Close attention needs to be paid to the upcoming inflation indicators this week to determine the secondary transmission logic of real interest rate trends to the foreign exchange market.
- Risk Warning and Disclaimer
- The market involves risk, and trading may not be suitable for all investors. This article is for reference only and does not constitute personal investment advice, nor does it take into account certain users’ specific investment objectives, financial situation, or other needs. Any investment decisions made based on this information are at your own risk.