Technical analysis: Spot gold volatility at yearly lows
2025-07-17 17:43:00
On Thursday (July 17), the daily chart of XAU/USD showed that the Average Directional Index (ADX) had fallen to its lowest level since early 2025, indicating a significant decline in gold price volatility.
Yesterday's release of the US Producer Price Index (PPI) initially triggered a sharp surge in gold prices, but the rally was short-lived and prices quickly fell back to their previous levels. This price action is consistent with the broader narrative of market equilibrium - that supply and demand are in a relatively balanced state, and the market seems to be effectively digesting key factors, including geopolitical tensions and tariff-related developments.
However, this fragile balance may soon be disrupted.
Technical Analysis
From a more macro technical perspective, gold prices remain within a long-term rising channel (highlighted in cyan) through 2025. Key observations include:
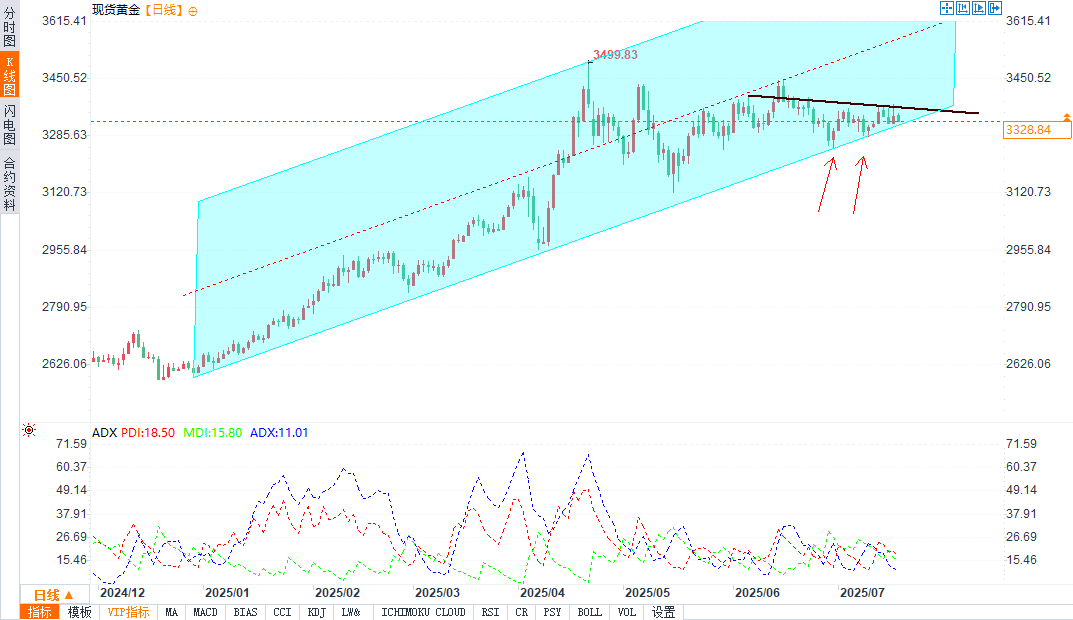
Attempts to bounce off the lower border of the channel (marked with an arrow) were unconvincing. The bulls failed to capitalize on these opportunities to reignite the uptrend, which suggests that buying interest might have been exhausted.
A trend line drawn connecting the major highs of 2025 has proven to be a strong resistance level. All recent breakout attempts have failed at this level.
Therefore, the technical picture of spot gold shows signs of forming a triangle pattern with its axis located near the $3,333 level. If the bulls continue to lose strength in the multi-month rebound, it may prompt the bears to challenge the lower boundary of the ascending channel, increasing the risk of a downside breakout.
At 17:35 Beijing time, spot gold was trading at $3,328.78 an ounce, down 0.56%.
Yesterday's release of the US Producer Price Index (PPI) initially triggered a sharp surge in gold prices, but the rally was short-lived and prices quickly fell back to their previous levels. This price action is consistent with the broader narrative of market equilibrium - that supply and demand are in a relatively balanced state, and the market seems to be effectively digesting key factors, including geopolitical tensions and tariff-related developments.
However, this fragile balance may soon be disrupted.
Technical Analysis
From a more macro technical perspective, gold prices remain within a long-term rising channel (highlighted in cyan) through 2025. Key observations include:
Attempts to bounce off the lower border of the channel (marked with an arrow) were unconvincing. The bulls failed to capitalize on these opportunities to reignite the uptrend, which suggests that buying interest might have been exhausted.
A trend line drawn connecting the major highs of 2025 has proven to be a strong resistance level. All recent breakout attempts have failed at this level.
Therefore, the technical picture of spot gold shows signs of forming a triangle pattern with its axis located near the $3,333 level. If the bulls continue to lose strength in the multi-month rebound, it may prompt the bears to challenge the lower boundary of the ascending channel, increasing the risk of a downside breakout.
At 17:35 Beijing time, spot gold was trading at $3,328.78 an ounce, down 0.56%.
- Risk Warning and Disclaimer
- The market involves risk, and trading may not be suitable for all investors. This article is for reference only and does not constitute personal investment advice, nor does it take into account certain users’ specific investment objectives, financial situation, or other needs. Any investment decisions made based on this information are at your own risk.