The US dollar regains the throne of safe-haven assets, is a breakthrough in the box in sight?
2025-06-19 18:21:36
On Thursday (June 19), the U.S. dollar index continued its status as a safe-haven asset. Driven by geopolitical concerns caused by the escalation of conflicts in the Middle East, it has continued to rise in recent days and traded around 99 in the European session. According to Reuters, market concerns about possible U.S. military intervention in Iran continued to ferment.
The dollar regained its safe-haven status mainly due to market concerns about the possible escalation of the conflict in the Middle East. Trump made vague remarks on whether the United States would launch a joint military operation with Israel against Iran, which made the market full of uncertainty. Bloomberg reported on Thursday that senior US officials are preparing for a possible strike against Iran, which continued to keep the market nervous.
According to Reuters, the Middle East conflict has entered its seventh day, with Israel bombing Iran's Arak heavy water nuclear reactor and Iranian missiles hitting multiple targets in central and southern Israel. The conflict has shown no signs of ending so far. The continued escalation of geopolitical risks has provided strong safe-haven demand support for the US dollar.
The Federal Reserve kept interest rates unchanged at 4.25%-4.50% on Wednesday and maintained expectations of two more rate cuts in 2025. However, Chairman Powell warned of impending inflationary pressures, especially the gradual effects of tariffs, which dampened the market's optimistic expectations for a near-term rate cut. Today, the U.S. market is closed for the Juneteenth holiday. Analysts believe that geopolitical tensions are expected to continue to dominate the market, and reduced liquidity may lead to a sharp increase in volatility.
From the daily chart, the US dollar index is currently running around 99, and the Bollinger Bands are shrinking, with the upper track at 100.7701, the middle track at 99, and the lower track at 97.7098. The price is currently running near the middle track of Bollinger, indicating that it is in a key technical position in the short term.
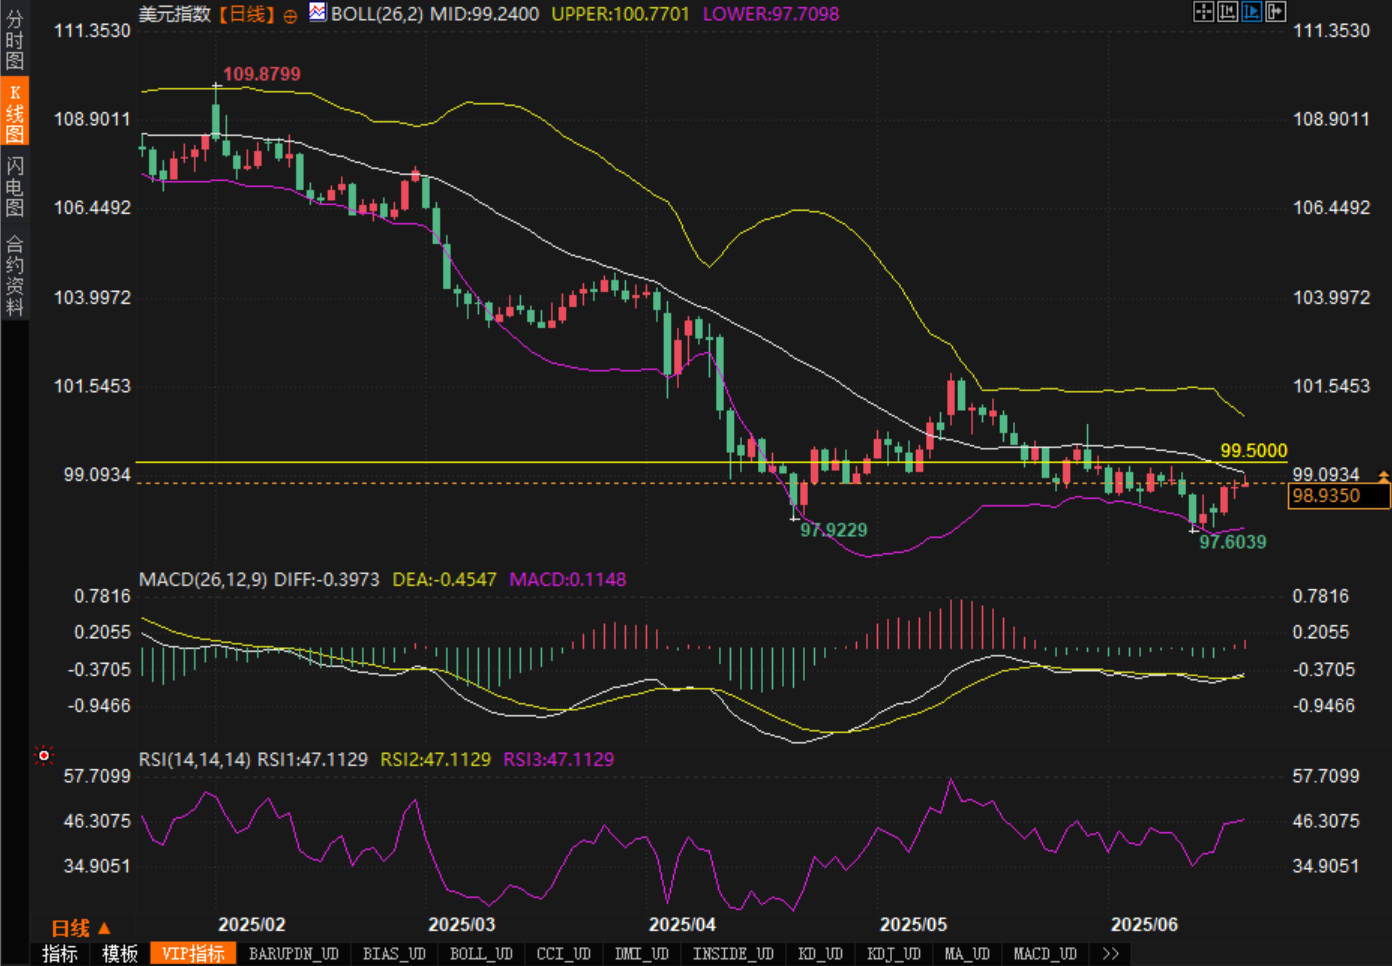
In terms of MACD indicators, the DIFF value is -0.3973, the DEA value is -0.4547, and the MACD histogram is 0.1148. The indicator is running below the zero axis but the histogram has turned positive, suggesting that the downward momentum has weakened.
The RSI indicator shows that the current value is 47.1129, which is slightly weak in the neutral area. It has neither entered the overbought nor oversold state, leaving room for two-way operation for subsequent market conditions.
In terms of price structure, after the price fell from the previous high of 109.8799, it formed an obvious box consolidation pattern in the range of 97.8-99.5000. The key resistance level is concentrated at 99.5000, which corresponds to the previous consolidation platform and psychological barrier at the same time, and has important technical significance. In terms of support, 97.6039 and 97.8 constitute a double support system, providing a relatively solid downward protection for the price.
The current market sentiment is clearly inclined towards risk aversion, and the continued escalation of geopolitical risks has led to a surge in demand for safe-haven assets. As a traditional safe-haven currency, the US dollar has regained the favor of funds amid the increasing global uncertainty. OCBC foreign exchange analysts pointed out that risk aversion dominated the market, and risk-sensitive currencies were under pressure.
In terms of the Fed's policy, although the expectation of two interest rate cuts this year was maintained, officials' concerns about the inflation outlook and the potential impact of tariff policies have caused the market to diverge on the timing of the rate cut. The dot plot shows that 7 of the 19 officials do not expect a rate cut this year, and this divergence reflects the uncertainty of the policy path.
In the short term, analysts believe that geopolitical risks are expected to continue to support the safe-haven demand for the US dollar. A breakthrough of the key resistance level of 99.5000 will be an important signal to determine whether the price can continue the upward trend. If this position is effectively broken, the US dollar index is expected to advance to the 100.2 and 100.60 levels, the latter corresponding to the 23.6% Fibonacci retracement level.
However, it is worth noting that the current technical indicators have not shown a strong trend signal. The MACD indicator shows signs of improvement but is still below the zero axis, and the RSI is in the neutral area, which suggests that the price may continue to consolidate in the current range. The box pattern of 97.8-99.5 may continue until there is a clear fundamental catalyst.
From a medium-term perspective, it is believed that inflation expectations and the Fed's policy path will become key variables affecting the trend of the US dollar. The market generally expects a 25 basis point rate cut in September and December, but analysts believe that the timing of the September rate cut may be too optimistic, and a larger adjustment of 50 basis points may occur in December. This difference in expectations provides potential support for the US dollar.
In the long term, analysts believe that the trend of the US dollar index will largely depend on the evolution of the geopolitical situation and the performance of the US economic fundamentals. If the conflict in the Middle East continues to escalate, safe-haven demand will provide continued support for the US dollar. On the contrary, if geopolitical risks ease and economic data weaken, the US dollar may face adjustment pressure. Currently, 97.60 and 98.00 constitute important support areas. Falling below this range will indicate the possibility of a deeper correction.
Fundamentals
The dollar regained its safe-haven status mainly due to market concerns about the possible escalation of the conflict in the Middle East. Trump made vague remarks on whether the United States would launch a joint military operation with Israel against Iran, which made the market full of uncertainty. Bloomberg reported on Thursday that senior US officials are preparing for a possible strike against Iran, which continued to keep the market nervous.
According to Reuters, the Middle East conflict has entered its seventh day, with Israel bombing Iran's Arak heavy water nuclear reactor and Iranian missiles hitting multiple targets in central and southern Israel. The conflict has shown no signs of ending so far. The continued escalation of geopolitical risks has provided strong safe-haven demand support for the US dollar.
The Federal Reserve kept interest rates unchanged at 4.25%-4.50% on Wednesday and maintained expectations of two more rate cuts in 2025. However, Chairman Powell warned of impending inflationary pressures, especially the gradual effects of tariffs, which dampened the market's optimistic expectations for a near-term rate cut. Today, the U.S. market is closed for the Juneteenth holiday. Analysts believe that geopolitical tensions are expected to continue to dominate the market, and reduced liquidity may lead to a sharp increase in volatility.
Technical aspects
From the daily chart, the US dollar index is currently running around 99, and the Bollinger Bands are shrinking, with the upper track at 100.7701, the middle track at 99, and the lower track at 97.7098. The price is currently running near the middle track of Bollinger, indicating that it is in a key technical position in the short term.
In terms of MACD indicators, the DIFF value is -0.3973, the DEA value is -0.4547, and the MACD histogram is 0.1148. The indicator is running below the zero axis but the histogram has turned positive, suggesting that the downward momentum has weakened.
The RSI indicator shows that the current value is 47.1129, which is slightly weak in the neutral area. It has neither entered the overbought nor oversold state, leaving room for two-way operation for subsequent market conditions.
In terms of price structure, after the price fell from the previous high of 109.8799, it formed an obvious box consolidation pattern in the range of 97.8-99.5000. The key resistance level is concentrated at 99.5000, which corresponds to the previous consolidation platform and psychological barrier at the same time, and has important technical significance. In terms of support, 97.6039 and 97.8 constitute a double support system, providing a relatively solid downward protection for the price.
Market sentiment observation
The current market sentiment is clearly inclined towards risk aversion, and the continued escalation of geopolitical risks has led to a surge in demand for safe-haven assets. As a traditional safe-haven currency, the US dollar has regained the favor of funds amid the increasing global uncertainty. OCBC foreign exchange analysts pointed out that risk aversion dominated the market, and risk-sensitive currencies were under pressure.
In terms of the Fed's policy, although the expectation of two interest rate cuts this year was maintained, officials' concerns about the inflation outlook and the potential impact of tariff policies have caused the market to diverge on the timing of the rate cut. The dot plot shows that 7 of the 19 officials do not expect a rate cut this year, and this divergence reflects the uncertainty of the policy path.
Outlook
In the short term, analysts believe that geopolitical risks are expected to continue to support the safe-haven demand for the US dollar. A breakthrough of the key resistance level of 99.5000 will be an important signal to determine whether the price can continue the upward trend. If this position is effectively broken, the US dollar index is expected to advance to the 100.2 and 100.60 levels, the latter corresponding to the 23.6% Fibonacci retracement level.
However, it is worth noting that the current technical indicators have not shown a strong trend signal. The MACD indicator shows signs of improvement but is still below the zero axis, and the RSI is in the neutral area, which suggests that the price may continue to consolidate in the current range. The box pattern of 97.8-99.5 may continue until there is a clear fundamental catalyst.
From a medium-term perspective, it is believed that inflation expectations and the Fed's policy path will become key variables affecting the trend of the US dollar. The market generally expects a 25 basis point rate cut in September and December, but analysts believe that the timing of the September rate cut may be too optimistic, and a larger adjustment of 50 basis points may occur in December. This difference in expectations provides potential support for the US dollar.
In the long term, analysts believe that the trend of the US dollar index will largely depend on the evolution of the geopolitical situation and the performance of the US economic fundamentals. If the conflict in the Middle East continues to escalate, safe-haven demand will provide continued support for the US dollar. On the contrary, if geopolitical risks ease and economic data weaken, the US dollar may face adjustment pressure. Currently, 97.60 and 98.00 constitute important support areas. Falling below this range will indicate the possibility of a deeper correction.
- Risk Warning and Disclaimer
- The market involves risk, and trading may not be suitable for all investors. This article is for reference only and does not constitute personal investment advice, nor does it take into account certain users’ specific investment objectives, financial situation, or other needs. Any investment decisions made based on this information are at your own risk.