The most comprehensive non-farm forecast suggests "another fake market"? It was brought forward to Thursday and was also hit by multiple hedge data
2025-07-03 12:08:55
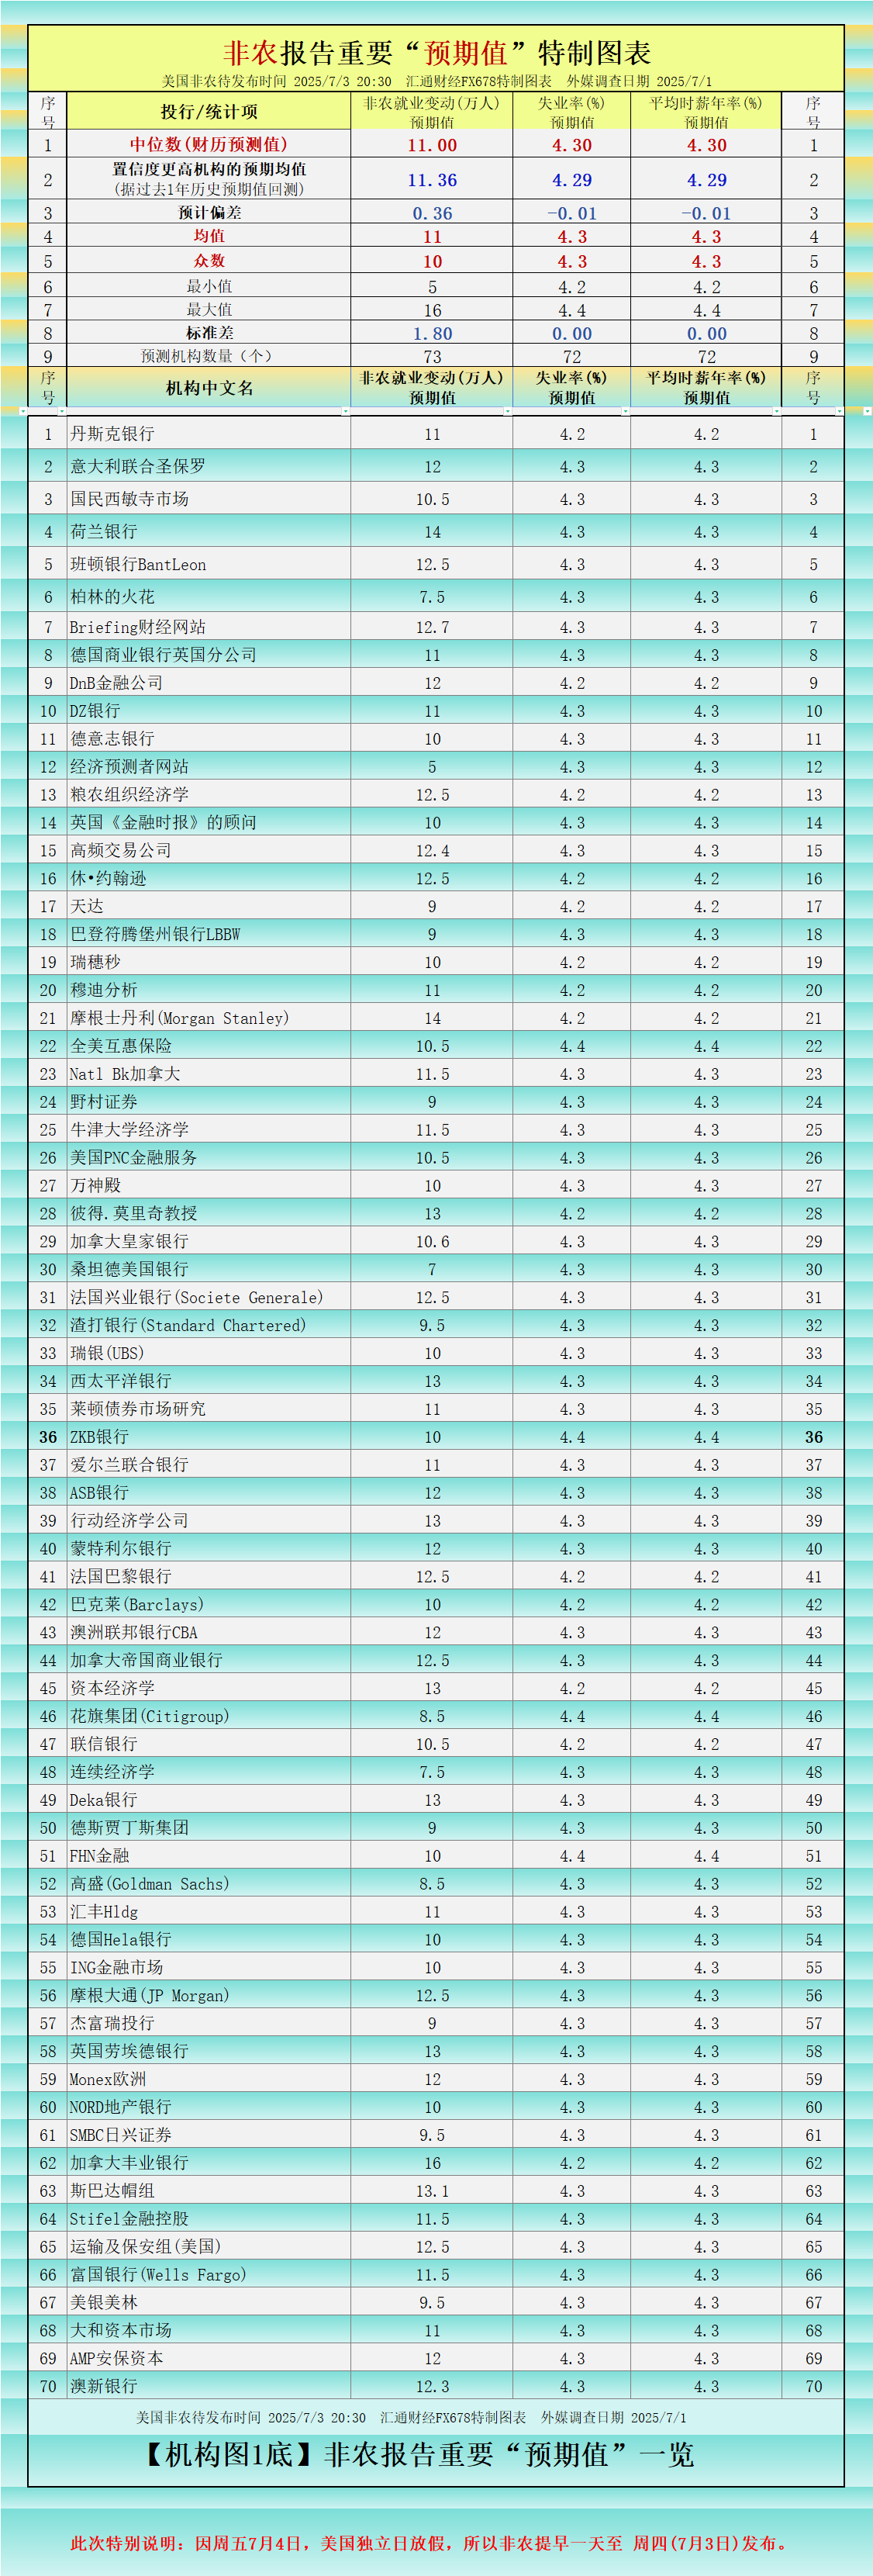
Non-farm payrolls will be released on Thursday (July 3), one day earlier than usual because July 4 (Friday) is the Independence Day holiday in the United States. Specifically, the highly anticipated US June non-farm payrolls report will be released on Thursday (2025/7/3 20:30). According to the forecast results of more than 79 internationally renowned investment banks/financial giants around the world, the expected change in non-farm payrolls is: an increase of 110,000, the expected unemployment rate is: 4.3%, and the expected annual average hourly wage rate is: 4.3%.
Figure 1 is known as the smarter forecast for non-agricultural employment: an increase of 113,600, slightly stronger than the expected median. Figure 5 shows that some of the latest "non-agricultural leading indicators" are also slightly stronger than the previous values. Therefore, there is a possibility that the non-agricultural situation tonight will be stronger than expected, but it is necessary to pay attention to whether the previous two data will be significantly revised down.
The recent "routine" of non-farm payrolls seems to be that the latest released value is strong, but the data of the previous two months have been significantly revised down. This kind of "false strength" usually brings about a "false market" and deserves close attention. What's more special is that there are several additional data released together with non-farm payrolls on Thursday: US trade account/initial jobless claims. (See Figure 4 below)
The specially prepared charts in this article show the expected data of each institution, as well as the expected mean, mode, maximum value, minimum value, prediction intervals of three confidence levels calculated based on the survey results, etc. See the table below for details.
As shown in Figure 1 below, there are 70 institutions/bigwigs who have given expected values for the "three indicators" (source: Huitong Finance special chart).
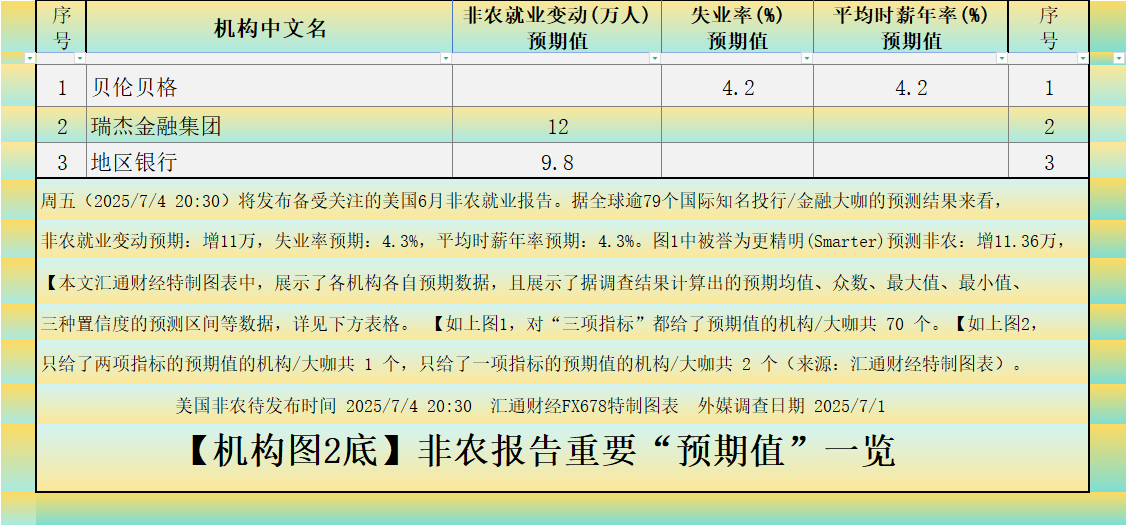
As shown in Figure 2 below, there is only one institution/big shot that gave the expected values for two indicators, and there are two institutions/big shots that only gave the expected value for one indicator (Source: Huitong Finance special chart).
In Figure 3 below, based on the principle of normal distribution, we can calculate the expected intervals corresponding to confidence levels of 68.2%, 95.5%, and 99.7%.
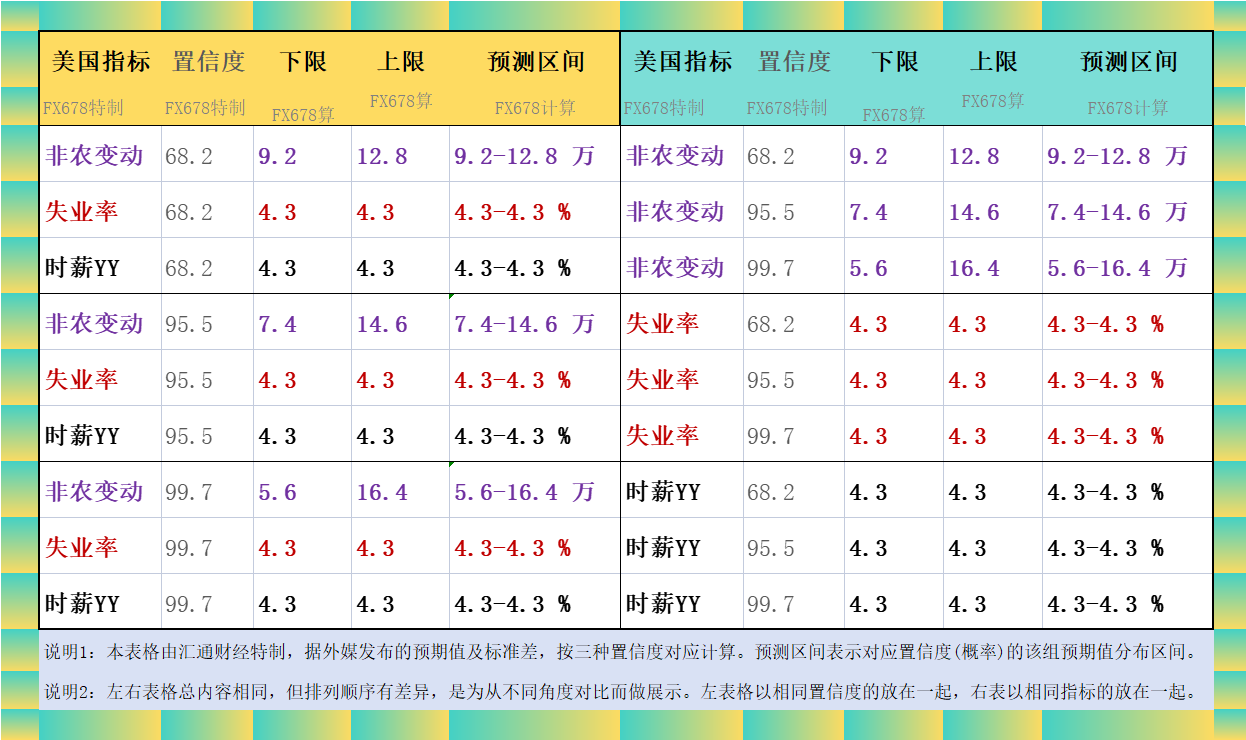
Figure 4 below shows you the details of the non-agricultural data and its sub-items that will be released tonight on the economic calendar page:
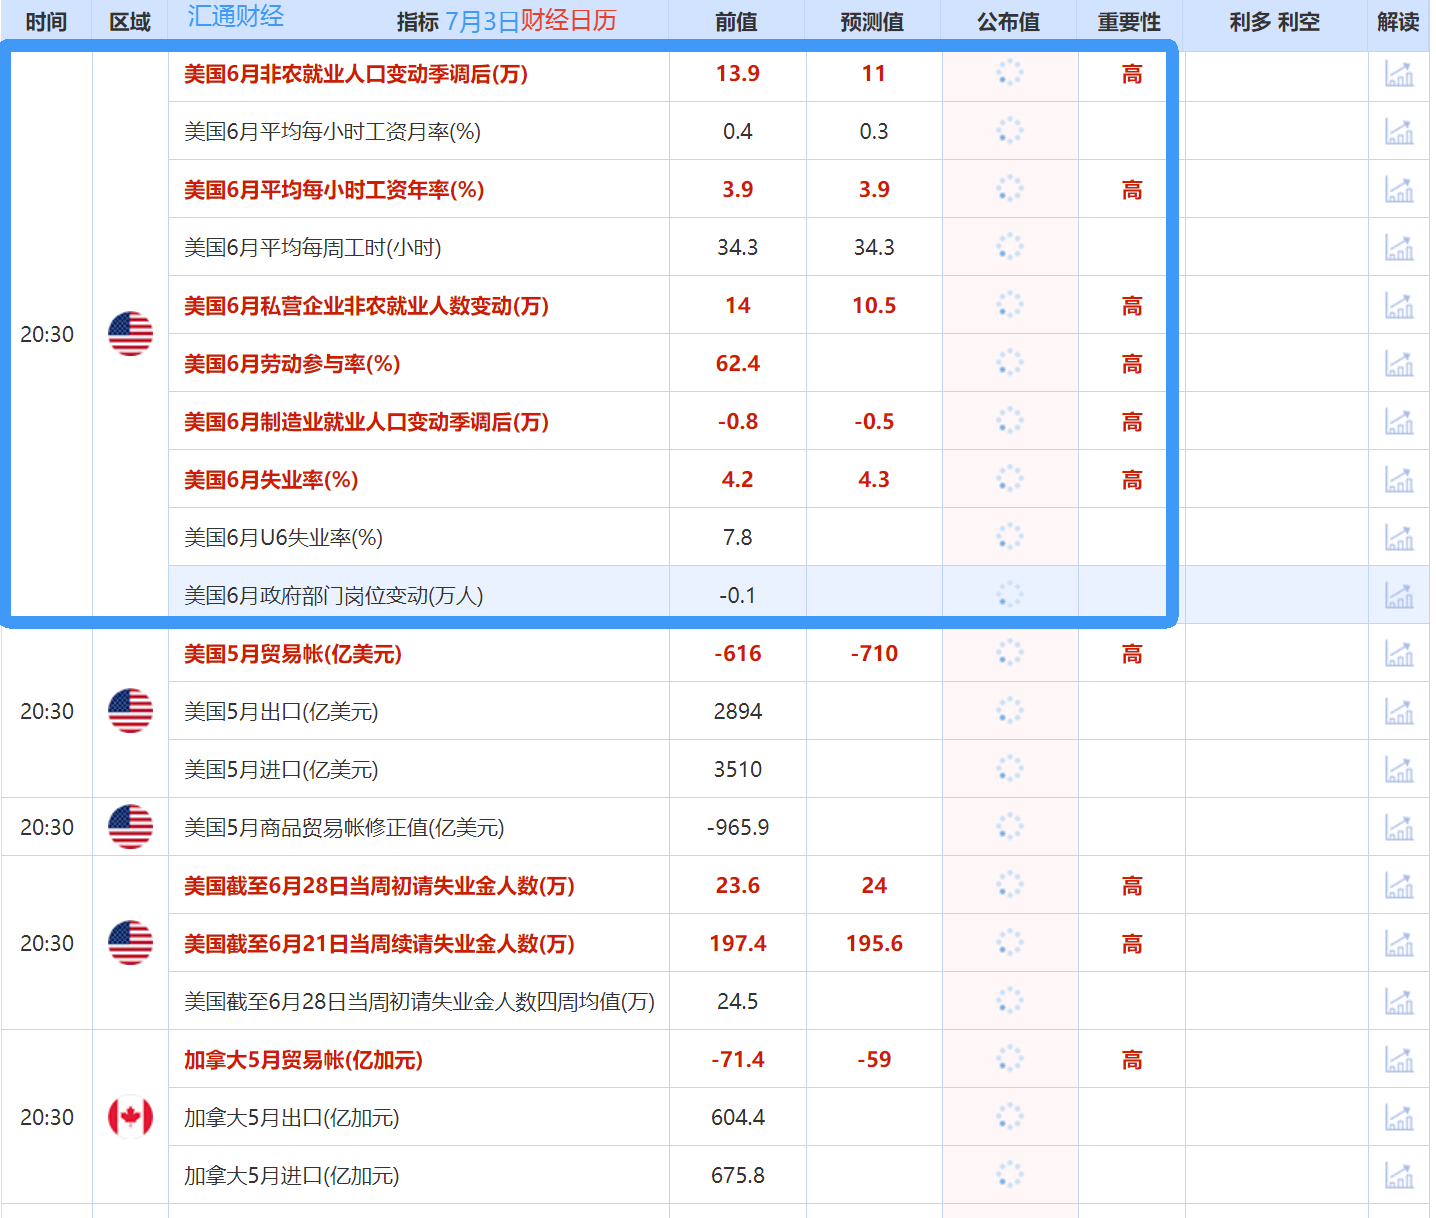
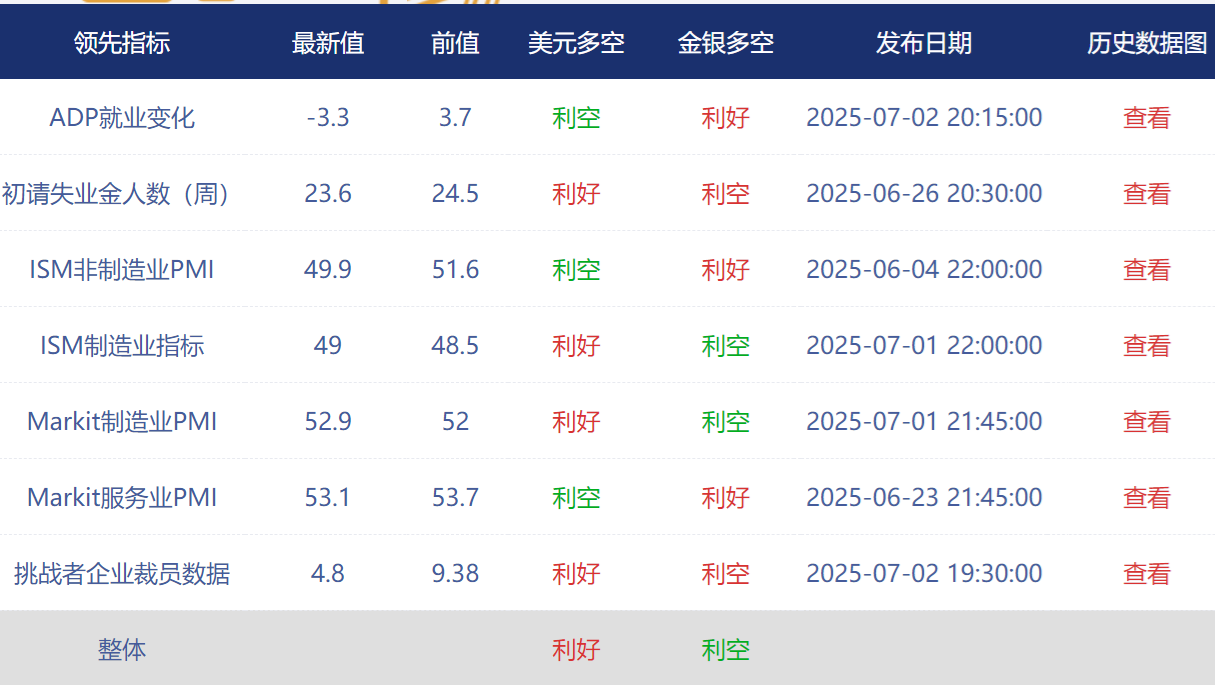
Figure 5 below shows the latest situation of the US "Non-farm Leading Indicator", which overall suggests that the US job market may be slightly stronger. Therefore, there is a possibility that the non-farm situation tonight will be stronger than expected (see Huitong Finance's non-farm special topic for more details).
It should be noted that even the most authoritative institutions may make inaccurate predictions. In the past, there have been cases where non-agricultural results were stronger than the strongest expectations. However, market investors make their layouts based on these forecast results, and the direction of market reactions is also based on these expected values to affect the direction of market long and short adjustments and market sentiment. Therefore, it is still very necessary to study the forecast values in advance.
This article is an original analysis by Huitong Finance Analysis, all rights reserved. It is for reference only and cannot be used as a basis for trading.
Figure 1 is known as the smarter forecast for non-agricultural employment: an increase of 113,600, slightly stronger than the expected median. Figure 5 shows that some of the latest "non-agricultural leading indicators" are also slightly stronger than the previous values. Therefore, there is a possibility that the non-agricultural situation tonight will be stronger than expected, but it is necessary to pay attention to whether the previous two data will be significantly revised down.
The recent "routine" of non-farm payrolls seems to be that the latest released value is strong, but the data of the previous two months have been significantly revised down. This kind of "false strength" usually brings about a "false market" and deserves close attention. What's more special is that there are several additional data released together with non-farm payrolls on Thursday: US trade account/initial jobless claims. (See Figure 4 below)
The specially prepared charts in this article show the expected data of each institution, as well as the expected mean, mode, maximum value, minimum value, prediction intervals of three confidence levels calculated based on the survey results, etc. See the table below for details.
As shown in Figure 1 below, there are 70 institutions/bigwigs who have given expected values for the "three indicators" (source: Huitong Finance special chart).
As shown in Figure 2 below, there is only one institution/big shot that gave the expected values for two indicators, and there are two institutions/big shots that only gave the expected value for one indicator (Source: Huitong Finance special chart).
In Figure 3 below, based on the principle of normal distribution, we can calculate the expected intervals corresponding to confidence levels of 68.2%, 95.5%, and 99.7%.
Figure 4 below shows you the details of the non-agricultural data and its sub-items that will be released tonight on the economic calendar page:
Figure 5 below shows the latest situation of the US "Non-farm Leading Indicator", which overall suggests that the US job market may be slightly stronger. Therefore, there is a possibility that the non-farm situation tonight will be stronger than expected (see Huitong Finance's non-farm special topic for more details).
It should be noted that even the most authoritative institutions may make inaccurate predictions. In the past, there have been cases where non-agricultural results were stronger than the strongest expectations. However, market investors make their layouts based on these forecast results, and the direction of market reactions is also based on these expected values to affect the direction of market long and short adjustments and market sentiment. Therefore, it is still very necessary to study the forecast values in advance.
This article is an original analysis by Huitong Finance Analysis, all rights reserved. It is for reference only and cannot be used as a basis for trading.
- Risk Warning and Disclaimer
- The market involves risk, and trading may not be suitable for all investors. This article is for reference only and does not constitute personal investment advice, nor does it take into account certain users’ specific investment objectives, financial situation, or other needs. Any investment decisions made based on this information are at your own risk.