Technical analysis: The dollar is under pressure, and the yen attracts safe-haven inflows
2025-07-10 18:18:03
During the European session on Thursday (July 10), the USD/JPY price showed a trend of falling first and then rising. In the early trading session, the price started to fall from around 146.307, fell to a lower position, and then gradually rebounded, indicating that there was a certain game between the long and short sides during the day.
Geopolitical tensions and tariff risks are back in the spotlight, and the yen is once again attracting safe-haven buying. USD/JPY is flashing technical warning signs, with price action suggesting a possible bearish reversal in USD/JPY.
USD/JPY is showing signs of weakness as safe-haven flows push the yen higher. Symmetrical triangles and reversal patterns signal the arrival of key price levels.
Technical Analysis
The weekly USD/JPY chart shows that the pair is still in an overall downtrend, with prices consolidating within a symmetrical triangle, a pattern that is often interpreted as a bearish continuation pattern. The downside target of the triangle is expected to be around 136.18, but there are multiple support areas between 138.50 and 140.00 that may cushion the decline if there are no new catalysts for the yen or dollar.
Adding to the uncertainty, USD/JPY is currently trading between its 50-week and 200-week exponential moving averages (EMAs), further blurring the short-term technical outlook for the USD/JPY exchange rate.
The breakout direction of a symmetrical triangle is usually in line with the prevailing trend, which in this case means a bearish breakout is possible for USD/JPY. However, the pair may continue to consolidate in a narrowing range before a clear move emerges.
One possible catalyst for a stronger yen and weaker dollar is renewed tariff concerns, which could shift market focus back to expected rate cuts from the Federal Reserve and weaken the dollar.
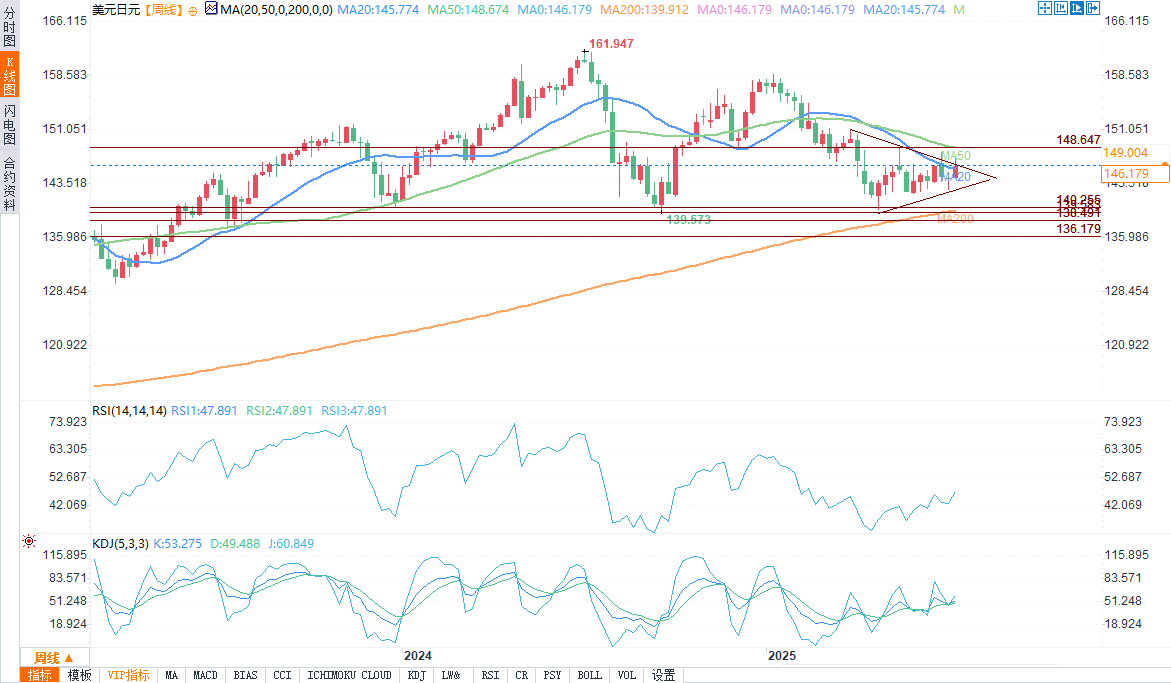
(Source of USD/JPY weekly chart: Yihuitong)
The weekly chart of USD/JPY shows that a symmetrical triangle pattern has formed below the 50-week and 200-week exponential moving averages. The overall downtrend since the January high (158.879) remains intact, with key resistance at 148.647 and layered support around 138.491. The arrow shows the possibility of a breakout, with a downside target expected at 136.179. Key support areas at the December 2023 low (140.255), March 2023 high (139.583), and 2024 low (137.912) are also highlighted, reinforcing the bearish potential if the support levels are broken.
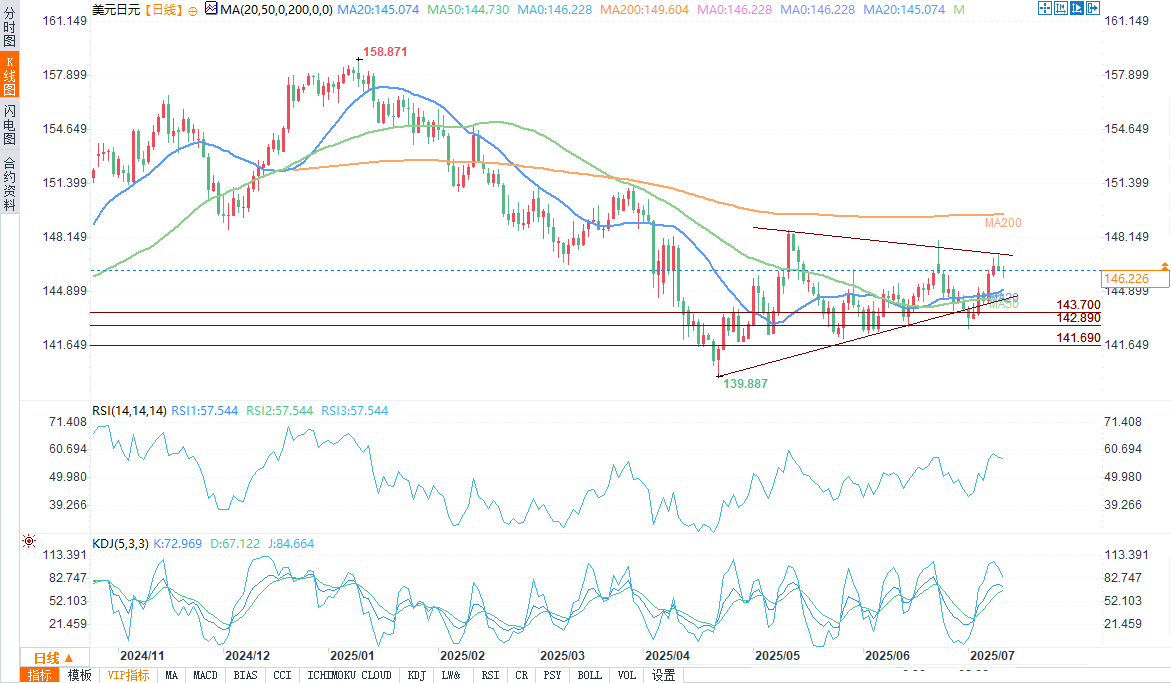
(Source of USD/JPY daily chart: Yihuitong)
The USD/JPY daily chart forms a small inverted hammer near the upper boundary of the triangle, which may be a top reversal signal. The candlestick is formed below the previous bearish spinning top and below the 200-day moving average, reinforcing the bearish pattern of USD/JPY.
Short-term bears may consider shorting near yesterday's highs, with stops above the 20-day moving average (147.9) and targets at the 50-day moving average (154.07). The high volume node (HVN) at 143.70 also provides a realistic short-term target for USD/JPY bears.
Nonetheless, for USD/JPY to decisively break below these levels, it would likely require a stronger USD-bearish catalyst, such as increased expectations of a Fed rate cut or weaker inflation data.
The daily USD/JPY chart shows a symmetrical triangle pattern forming between the 50-day and 200-day moving averages. An inverted hammer has formed near the upper band, indicating possible resistance and bearish reversal. The price is trading around 146.25, with support at 143.70 (high volume node), 142.89 (weekly VWAP), 142.71 (May low), and 141.69. The arrows highlight possible pullbacks and bearish breakout scenarios. Volume distribution and exponential moving averages provide additional technical context.
At 18:10 Beijing time, USD/JPY was at 146.215/226, down 0.06%.
Geopolitical tensions and tariff risks are back in the spotlight, and the yen is once again attracting safe-haven buying. USD/JPY is flashing technical warning signs, with price action suggesting a possible bearish reversal in USD/JPY.
USD/JPY is showing signs of weakness as safe-haven flows push the yen higher. Symmetrical triangles and reversal patterns signal the arrival of key price levels.
Technical Analysis
The weekly USD/JPY chart shows that the pair is still in an overall downtrend, with prices consolidating within a symmetrical triangle, a pattern that is often interpreted as a bearish continuation pattern. The downside target of the triangle is expected to be around 136.18, but there are multiple support areas between 138.50 and 140.00 that may cushion the decline if there are no new catalysts for the yen or dollar.
Adding to the uncertainty, USD/JPY is currently trading between its 50-week and 200-week exponential moving averages (EMAs), further blurring the short-term technical outlook for the USD/JPY exchange rate.
The breakout direction of a symmetrical triangle is usually in line with the prevailing trend, which in this case means a bearish breakout is possible for USD/JPY. However, the pair may continue to consolidate in a narrowing range before a clear move emerges.
One possible catalyst for a stronger yen and weaker dollar is renewed tariff concerns, which could shift market focus back to expected rate cuts from the Federal Reserve and weaken the dollar.
(Source of USD/JPY weekly chart: Yihuitong)
The weekly chart of USD/JPY shows that a symmetrical triangle pattern has formed below the 50-week and 200-week exponential moving averages. The overall downtrend since the January high (158.879) remains intact, with key resistance at 148.647 and layered support around 138.491. The arrow shows the possibility of a breakout, with a downside target expected at 136.179. Key support areas at the December 2023 low (140.255), March 2023 high (139.583), and 2024 low (137.912) are also highlighted, reinforcing the bearish potential if the support levels are broken.
(Source of USD/JPY daily chart: Yihuitong)
The USD/JPY daily chart forms a small inverted hammer near the upper boundary of the triangle, which may be a top reversal signal. The candlestick is formed below the previous bearish spinning top and below the 200-day moving average, reinforcing the bearish pattern of USD/JPY.
Short-term bears may consider shorting near yesterday's highs, with stops above the 20-day moving average (147.9) and targets at the 50-day moving average (154.07). The high volume node (HVN) at 143.70 also provides a realistic short-term target for USD/JPY bears.
Nonetheless, for USD/JPY to decisively break below these levels, it would likely require a stronger USD-bearish catalyst, such as increased expectations of a Fed rate cut or weaker inflation data.
The daily USD/JPY chart shows a symmetrical triangle pattern forming between the 50-day and 200-day moving averages. An inverted hammer has formed near the upper band, indicating possible resistance and bearish reversal. The price is trading around 146.25, with support at 143.70 (high volume node), 142.89 (weekly VWAP), 142.71 (May low), and 141.69. The arrows highlight possible pullbacks and bearish breakout scenarios. Volume distribution and exponential moving averages provide additional technical context.
At 18:10 Beijing time, USD/JPY was at 146.215/226, down 0.06%.
- Risk Warning and Disclaimer
- The market involves risk, and trading may not be suitable for all investors. This article is for reference only and does not constitute personal investment advice, nor does it take into account certain users’ specific investment objectives, financial situation, or other needs. Any investment decisions made based on this information are at your own risk.