Technical analysis: Gold's new bulls accelerate upward, breaking through key resistance area
2025-07-12 01:22:27
On Friday (July 12), gold prices accelerated higher, breaking through the upper track of the triangle pattern on the daily chart ($3,327) and conquering the next important resistance level of $3,350 (which is both the 50% Fibonacci retracement level of the $3,452 to $3,245 range and the Kijun-Sen line on the daily chart).
Gold prices rebounded after encountering double support at the top of the cloud on the daily chart and the psychological support level ($3,300), and have now continued to rise for the third consecutive trading day, and the rise accelerated further on Friday. This trend stems from President Trump's unexpected announcement of new tariffs on Canada and threats to impose more tariffs on other trading partners, which stimulated the market's safe-haven demand.
The technical picture on the daily chart is improving (moving averages form a bullish alignment, the 14-day momentum indicator has risen back near the mid-axis and is expected to break into positive territory), paving the way for further upside in gold prices and a firm hold of the key $3,350-3,365 resistance area.
If this breakthrough can be achieved, the daily chart will complete a bullish "failure swing" pattern, releasing a new bullish signal, pushing the price of gold to $3,373 (61.8% Fibonacci retracement level), and may even touch the psychological level of $3,400 in the future.
The rising Tenkan-sen line in the hourly chart provides support at $3,341, and the lower support is the bottom of the hourly chart at $3,331 (also the kijun-sen line in the hourly chart). It is expected that gold prices will receive strong support when they pull back to these positions, maintaining the dominance of the new bulls.
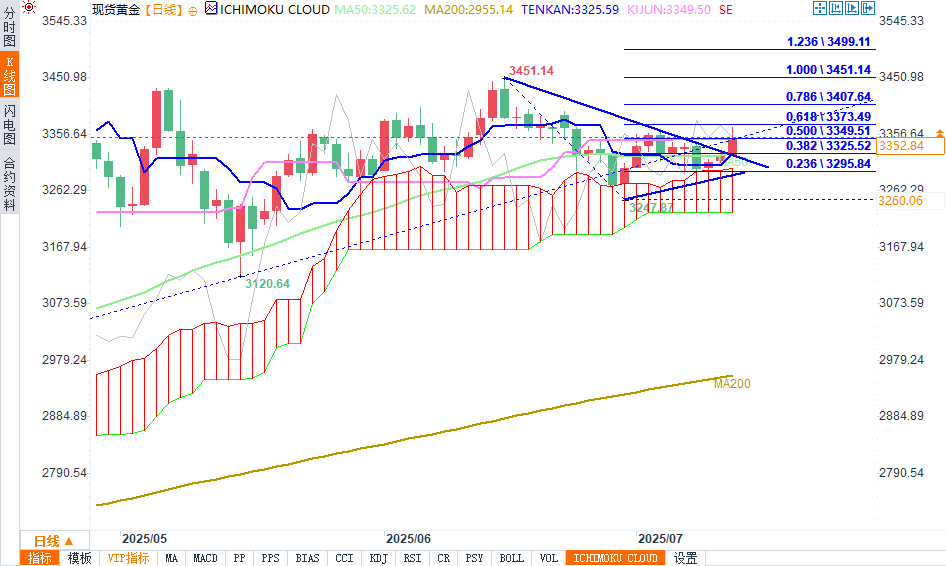
(Source of spot gold daily chart: Yihuitong)
Resistance levels: $3,365; $3,373; $3,392; $3,400
Support levels: $3,350; $3,341; $3,331; $3,325
At 00:55 Beijing time, spot gold was quoted at US$3,354.70 per ounce, up 0.93%.
(Note: "Tenkan-sen" and "Kijun-sen" in this article are terms for Japanese candlestick chart technical indicators, corresponding to "conversion line" and "base line" respectively. They are important components of the Ichimoku Kinko Hyo indicator and are usually used to determine trends and support and resistance levels.)
Gold prices rebounded after encountering double support at the top of the cloud on the daily chart and the psychological support level ($3,300), and have now continued to rise for the third consecutive trading day, and the rise accelerated further on Friday. This trend stems from President Trump's unexpected announcement of new tariffs on Canada and threats to impose more tariffs on other trading partners, which stimulated the market's safe-haven demand.
The technical picture on the daily chart is improving (moving averages form a bullish alignment, the 14-day momentum indicator has risen back near the mid-axis and is expected to break into positive territory), paving the way for further upside in gold prices and a firm hold of the key $3,350-3,365 resistance area.
If this breakthrough can be achieved, the daily chart will complete a bullish "failure swing" pattern, releasing a new bullish signal, pushing the price of gold to $3,373 (61.8% Fibonacci retracement level), and may even touch the psychological level of $3,400 in the future.
The rising Tenkan-sen line in the hourly chart provides support at $3,341, and the lower support is the bottom of the hourly chart at $3,331 (also the kijun-sen line in the hourly chart). It is expected that gold prices will receive strong support when they pull back to these positions, maintaining the dominance of the new bulls.
(Source of spot gold daily chart: Yihuitong)
Resistance levels: $3,365; $3,373; $3,392; $3,400
Support levels: $3,350; $3,341; $3,331; $3,325
At 00:55 Beijing time, spot gold was quoted at US$3,354.70 per ounce, up 0.93%.
(Note: "Tenkan-sen" and "Kijun-sen" in this article are terms for Japanese candlestick chart technical indicators, corresponding to "conversion line" and "base line" respectively. They are important components of the Ichimoku Kinko Hyo indicator and are usually used to determine trends and support and resistance levels.)
- Risk Warning and Disclaimer
- The market involves risk, and trading may not be suitable for all investors. This article is for reference only and does not constitute personal investment advice, nor does it take into account certain users’ specific investment objectives, financial situation, or other needs. Any investment decisions made based on this information are at your own risk.