The US dollar data is released continuously, the euro accelerates downward, and the technical alarm is sounded
2025-07-17 21:47:20
On Thursday (July 17), with the release of a series of US macro data, market volatility intensified again. The US dollar index (DXY) continued to be strong, rising to around 98.90 during the day, recovering the previous day's losses. Affected by this, the EUR/USD exchange rate continued to fall, hitting a weekly low of 1.1556 during the session.

The U.S. Department of Labor announced that the number of initial unemployment claims fell to 221,000 in the week ending July 12, a three-month low. At the same time, the monthly rate of retail sales in June was +0.6%, far better than the expected value of 0.1%, and the annual rate rose to 3.9%, demonstrating the resilience of U.S. household consumption. Another data, the Philadelphia Fed Manufacturing Index in July jumped to 15.9, far exceeding the expected -1. This series of good news consolidated the market's expectation that the Federal Reserve will continue to maintain high interest rates, thereby driving the dollar to rebound.
Recently, a series of macroeconomic data in the United States have released positive signals. The job market remains stable, with initial jobless claims at 221,000, lower than the expected 235,000 and lower than the previous value of 228,000 (after revision), confirming the logic that the Federal Reserve is not in a hurry to change its monetary policy path. At the same time, the number of people continuing to apply for unemployment benefits increased slightly to 1.956 million, but was still lower than the market's expected value, indicating that the labor market still has a certain ability to withstand pressure.
On the other hand, the retail sales data in June was much better than expected, with the monthly rate rising to +0.6% and the annual rate recording +3.9%, which is the highest level since 2025. In particular, the total sales in the second quarter increased by 4.1% year-on-year, indicating that the basic foundation of US consumption is stable. At the same time, US export prices rose by 0.5% month-on-month in June, while import prices only rose by 0.1%, showing that the resilience of external demand is stronger than domestic demand input inflation.
In this context, the US dollar index maintained a strong consolidation, and the market expected that the probability of the Federal Reserve maintaining the current high interest rate in the short term would increase, which would continue to put pressure on the euro. In the euro area, although the annual HICP rate in June remained stable at 2%, it was not enough to form a counter-pressure effect. The current gap in monetary policy expectations between Europe and the United States continued to widen, causing the fundamental center of gravity of the euro/dollar to tilt downward.
The EUR/USD shows a clear downward channel structure on the 4-hour chart, and the three tracks of the Bollinger Bands also move downward synchronously, indicating that the medium- and short-term trend momentum is weak. The current exchange rate is running near the lower track of the Bollinger Bands and the lower line of the downward channel, forming an "accelerated downward" trend. The price center of gravity continues to move downward, indicating that the bears are still dominating the market.
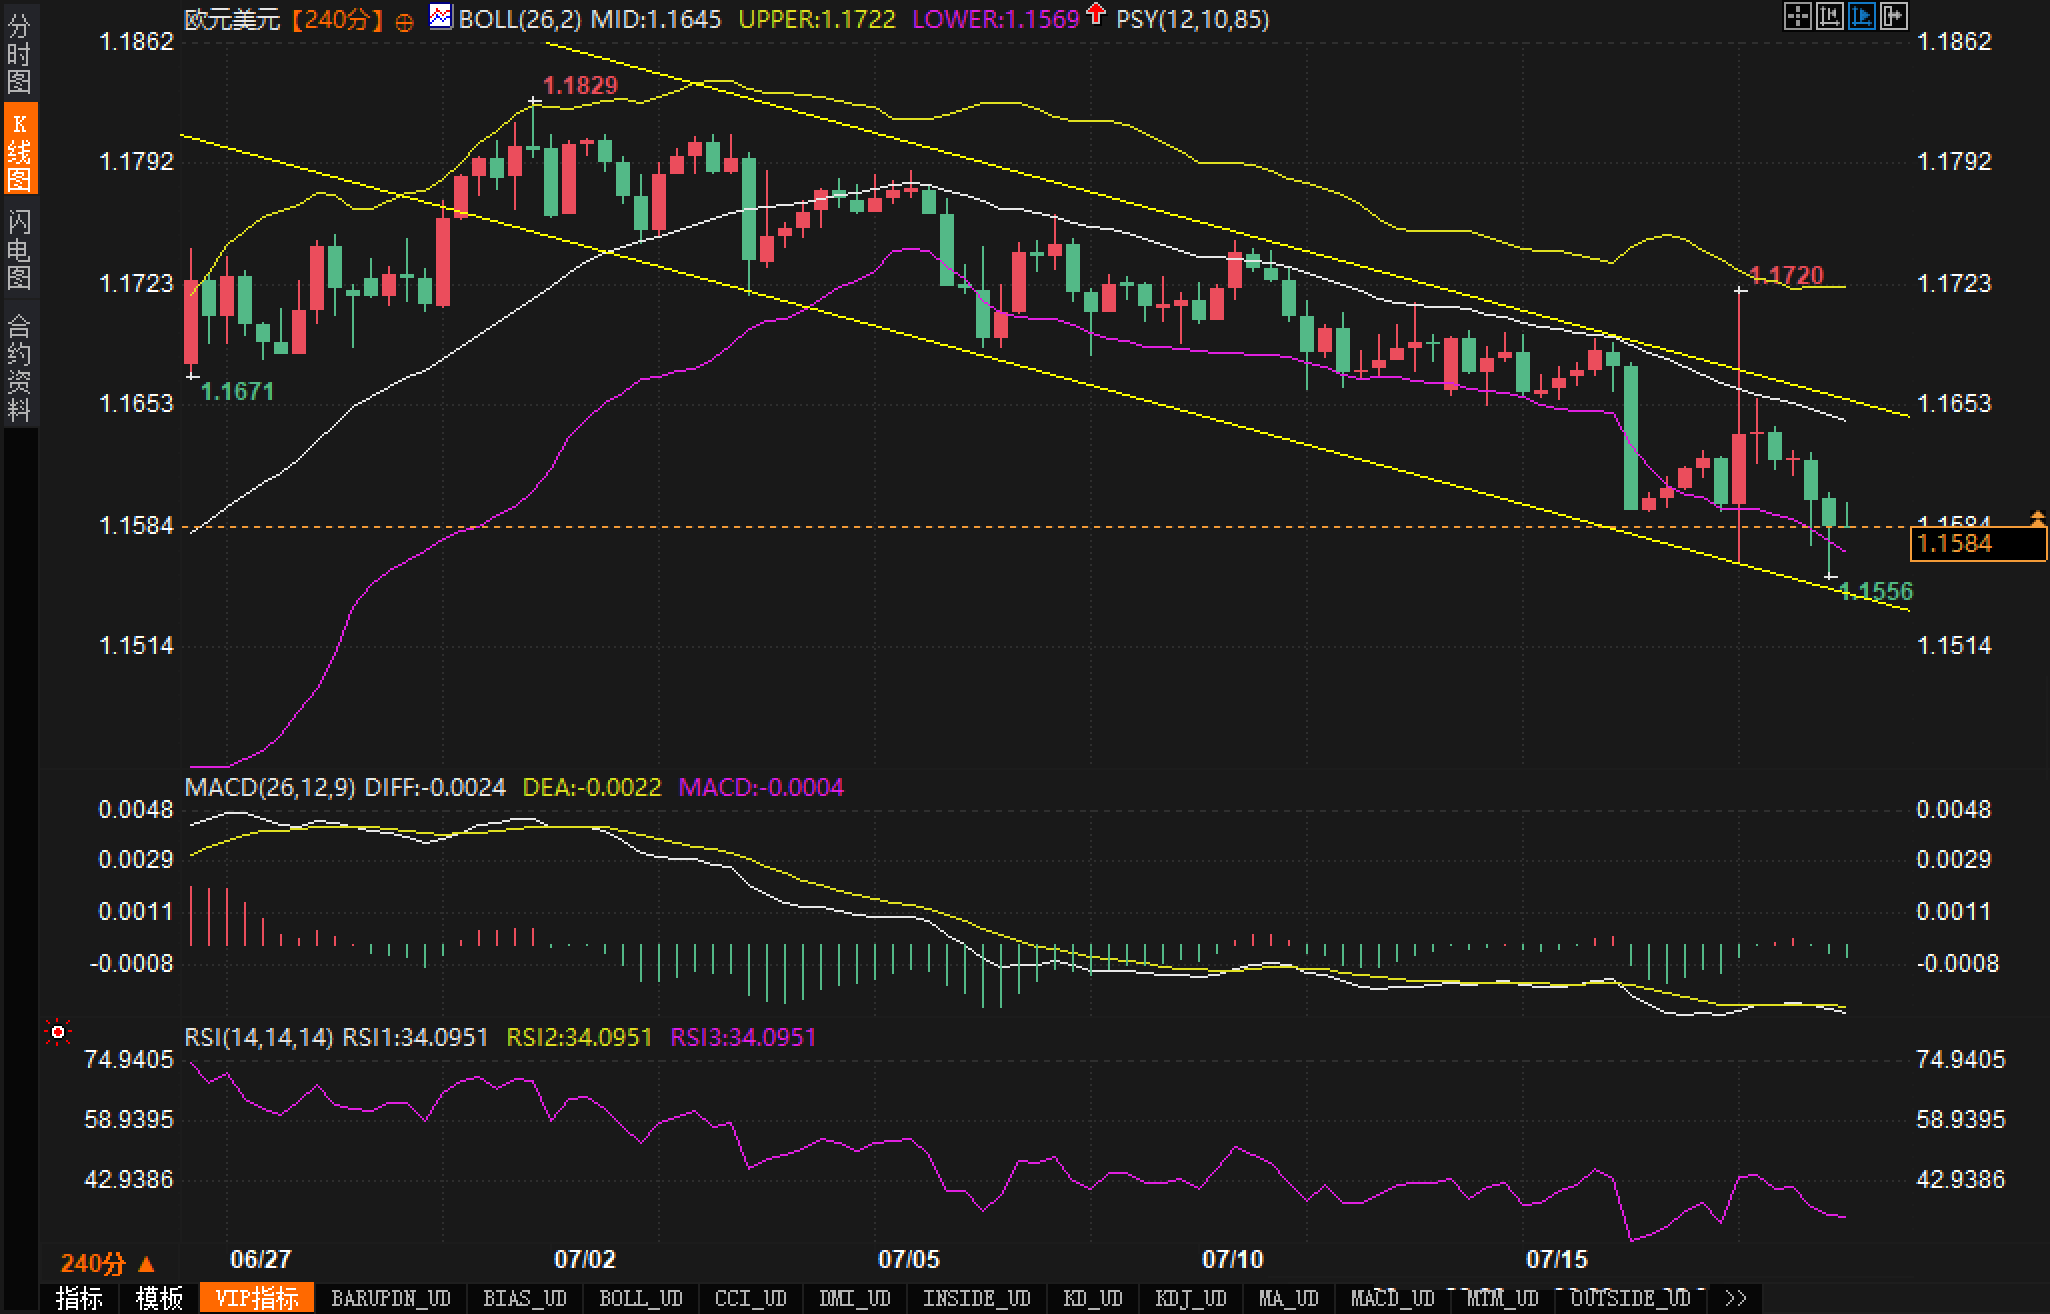
Specifically, the exchange rate recently rebounded to around 1.1720 before falling back quickly, forming a typical "downward relay" pattern. The subsequent negative line continuously swallowed up the previous gains and fell below the 1.16 support, further dropping to 1.1556, approaching the lower boundary of the downward channel, and the short-term risk signal is obvious.
In terms of MACD indicators, DIFF and DEA are always below the zero axis and move downward synchronously. The green column of the histogram is enlarged again, indicating that the short-selling momentum is strengthened again. The RSI indicator is running near 34. Although it has not entered the extreme oversold area, it still maintains a downward trend, indicating that the market has not yet shown an obvious bottom divergence structure.
Comprehensive analysis shows that the current technical structure shows a pattern of "weak rebound and strong decline". The short-term support level is 1.1550-1.1530. Once it is effectively broken, it is expected to fall to the previous platform of 1.1453. The upper resistance is located in the two previous highs of 1.1645 and 1.1720.
From the perspective of market sentiment, the current market sentiment is obviously short. The buying momentum of the US dollar brought by the unexpected US data and the accelerated breakdown of the technical pattern have put the EUR/USD bulls in a continuous passive state and lacked effective counterattack.
Although the exchange rate is approaching the technical support range in the short term, there are no obvious "sentiment reversal" signals, such as long stop loss structure, divergence pattern or strong support confirmation. At present, the sentiment is bearish, technical indicators are all downward, and there is no volume divergence or other bottoming signs, reflecting that the market has not yet established an effective "buy consensus".
In addition, observing from the bandwidth of the Bollinger Bands in the figure, there is no extreme narrowing at present, suggesting that there may still be room for volatility expansion in the exchange rate in the short term. If the news is bearish again, the market may further strengthen the bearish sentiment.
Bullish Outlook:
Analysts believe that if the US economic data weakens in the future, or the market begins to re-evaluate the Fed's policy path, and there is a valuation correction caused by the rapid appreciation of the US dollar, the EUR/USD will have a chance of a technical rebound. The current RSI indicator is close to the oversold zone. Once a bottom divergence is formed or the price rises above 1.1645 again, the exchange rate is expected to rebound to a certain extent. The upper resistance reference is 1.1720 and the middle track of the Bollinger band.
Bearish Outlook:
Analysts believe that if the subsequent US macro data continues to perform strongly, especially employment and consumption remain resilient, and the Federal Reserve releases hawkish signals of stability, the EUR/USD may continue its downward trend. The current technical pattern supports further declines, with support below focusing on 1.1530 and 1.1453. Once the latter is effectively broken, the possibility of testing 1.1400 or even lower support levels cannot be ruled out.
The U.S. Department of Labor announced that the number of initial unemployment claims fell to 221,000 in the week ending July 12, a three-month low. At the same time, the monthly rate of retail sales in June was +0.6%, far better than the expected value of 0.1%, and the annual rate rose to 3.9%, demonstrating the resilience of U.S. household consumption. Another data, the Philadelphia Fed Manufacturing Index in July jumped to 15.9, far exceeding the expected -1. This series of good news consolidated the market's expectation that the Federal Reserve will continue to maintain high interest rates, thereby driving the dollar to rebound.
Fundamentals
Recently, a series of macroeconomic data in the United States have released positive signals. The job market remains stable, with initial jobless claims at 221,000, lower than the expected 235,000 and lower than the previous value of 228,000 (after revision), confirming the logic that the Federal Reserve is not in a hurry to change its monetary policy path. At the same time, the number of people continuing to apply for unemployment benefits increased slightly to 1.956 million, but was still lower than the market's expected value, indicating that the labor market still has a certain ability to withstand pressure.
On the other hand, the retail sales data in June was much better than expected, with the monthly rate rising to +0.6% and the annual rate recording +3.9%, which is the highest level since 2025. In particular, the total sales in the second quarter increased by 4.1% year-on-year, indicating that the basic foundation of US consumption is stable. At the same time, US export prices rose by 0.5% month-on-month in June, while import prices only rose by 0.1%, showing that the resilience of external demand is stronger than domestic demand input inflation.
In this context, the US dollar index maintained a strong consolidation, and the market expected that the probability of the Federal Reserve maintaining the current high interest rate in the short term would increase, which would continue to put pressure on the euro. In the euro area, although the annual HICP rate in June remained stable at 2%, it was not enough to form a counter-pressure effect. The current gap in monetary policy expectations between Europe and the United States continued to widen, causing the fundamental center of gravity of the euro/dollar to tilt downward.
Technical aspects:
The EUR/USD shows a clear downward channel structure on the 4-hour chart, and the three tracks of the Bollinger Bands also move downward synchronously, indicating that the medium- and short-term trend momentum is weak. The current exchange rate is running near the lower track of the Bollinger Bands and the lower line of the downward channel, forming an "accelerated downward" trend. The price center of gravity continues to move downward, indicating that the bears are still dominating the market.
Specifically, the exchange rate recently rebounded to around 1.1720 before falling back quickly, forming a typical "downward relay" pattern. The subsequent negative line continuously swallowed up the previous gains and fell below the 1.16 support, further dropping to 1.1556, approaching the lower boundary of the downward channel, and the short-term risk signal is obvious.
In terms of MACD indicators, DIFF and DEA are always below the zero axis and move downward synchronously. The green column of the histogram is enlarged again, indicating that the short-selling momentum is strengthened again. The RSI indicator is running near 34. Although it has not entered the extreme oversold area, it still maintains a downward trend, indicating that the market has not yet shown an obvious bottom divergence structure.
Comprehensive analysis shows that the current technical structure shows a pattern of "weak rebound and strong decline". The short-term support level is 1.1550-1.1530. Once it is effectively broken, it is expected to fall to the previous platform of 1.1453. The upper resistance is located in the two previous highs of 1.1645 and 1.1720.
Market sentiment observation
From the perspective of market sentiment, the current market sentiment is obviously short. The buying momentum of the US dollar brought by the unexpected US data and the accelerated breakdown of the technical pattern have put the EUR/USD bulls in a continuous passive state and lacked effective counterattack.
Although the exchange rate is approaching the technical support range in the short term, there are no obvious "sentiment reversal" signals, such as long stop loss structure, divergence pattern or strong support confirmation. At present, the sentiment is bearish, technical indicators are all downward, and there is no volume divergence or other bottoming signs, reflecting that the market has not yet established an effective "buy consensus".
In addition, observing from the bandwidth of the Bollinger Bands in the figure, there is no extreme narrowing at present, suggesting that there may still be room for volatility expansion in the exchange rate in the short term. If the news is bearish again, the market may further strengthen the bearish sentiment.
Outlook
Bullish Outlook:
Analysts believe that if the US economic data weakens in the future, or the market begins to re-evaluate the Fed's policy path, and there is a valuation correction caused by the rapid appreciation of the US dollar, the EUR/USD will have a chance of a technical rebound. The current RSI indicator is close to the oversold zone. Once a bottom divergence is formed or the price rises above 1.1645 again, the exchange rate is expected to rebound to a certain extent. The upper resistance reference is 1.1720 and the middle track of the Bollinger band.
Bearish Outlook:
Analysts believe that if the subsequent US macro data continues to perform strongly, especially employment and consumption remain resilient, and the Federal Reserve releases hawkish signals of stability, the EUR/USD may continue its downward trend. The current technical pattern supports further declines, with support below focusing on 1.1530 and 1.1453. Once the latter is effectively broken, the possibility of testing 1.1400 or even lower support levels cannot be ruled out.
- Risk Warning and Disclaimer
- The market involves risk, and trading may not be suitable for all investors. This article is for reference only and does not constitute personal investment advice, nor does it take into account certain users’ specific investment objectives, financial situation, or other needs. Any investment decisions made based on this information are at your own risk.