The "nuclear explosion point" of interest rate expectations is approaching: the US dollar technically shows a "death cross", and the upper track of the gold Bollinger channel is hit by short sellers
2025-07-18 20:29:25
On Friday (July 18), Beijing time, global financial markets experienced increased volatility during the critical window period before the Fed's interest rate decision. The U.S. dollar index was last reported at 98.2742, down 0.38% on the day, showing the market's cautious sentiment towards the Fed's policy outlook. During the same period, the spot gold price was reported at $3,357.78 per ounce, up 0.57% on the day, reflecting the rebound in safe-haven demand amid tariff rhetoric and inflationary pressures. The Fed is about to hold an interest rate meeting on July 29-30, and the market generally expects it to maintain the benchmark interest rate at 4.25%-4.50%, but the unexpected increase in inflation data and the market uncertainty caused by Trump's tariff rhetoric have made investors' judgment on the future policy path more complicated.
This article will combine the latest market data with fundamental dynamics to deeply analyze the impact of the Federal Reserve’s interest rate expectations on the U.S. dollar and gold, and explore short-term trends from a technical perspective.

The Fed's current monetary policy is at a critical turning point. The latest data shows that the US CPI inflation rate rose from 2.4% in May to 2.7% in June, exceeding market expectations, while the core CPI (excluding food and energy) climbed to 2.8%. This trend shows that inflationary pressure is shifting from the post-epidemic decline period to a new upward cycle. Well-known institutions have pointed out that the breadth of inflation is expanding, with the annualized increase in prices of nearly half of the commodities reaching more than 5%, doubling from January. This phenomenon is partly attributed to the tariff policy that Trump quickly implemented after taking office. Although the direct price effect of tariffs is theoretically a one-time shock, the current US economic growth is above the trend level and the labor market is still tight, and the upward pressure on prices may be more persistent.
The differences within the Fed on the policy path have further emerged. A Fed governor stressed that current inflation expectations have not yet been fully anchored, and it is crucial to maintain a tight policy to curb inflationary psychology. She expects the personal consumption expenditure (PCE) price index to rise further in the coming months, possibly reaching 2.5% in June, and the core PCE may reach 2.8%. This view is consistent with the statement of the president of the Atlanta Fed, who pointed out that the June inflation data "deviated from the target" and the widespread nature of price pressures was worrying. In contrast, another governor who was mentioned as a potential candidate for the Fed chairman held a different view, believing that the upside risks to inflation are limited, signs of economic slowdown have emerged, and that the meeting at the end of July should consider cutting interest rates to avoid a deterioration in the labor market.
Trump's tariff rhetoric has added an extra layer of complexity to the market. He has recently put pressure on the Federal Reserve to slash interest rates to reduce the cost of financing the federal deficit, but the Fed's mission is to stabilize inflation rather than cooperate with fiscal policy. The market was once volatile due to rumors that Trump might replace the Fed chairman, causing a short-term jump in U.S. Treasury yields and pressure on the U.S. dollar index. Despite this, the Fed's policy outlook has not changed fundamentally, and the probability of keeping interest rates unchanged at the July meeting is close to 100%. The market focus has shifted to the September meeting, where investors expect a 25 basis point rate cut, but the latest inflation data has lowered this probability from a high level to close to 50%.
The continued tension between Russia and Ukraine and the uncertainty of the global supply chain have further boosted risk aversion, benefiting spot gold. The tariff policy has not yet fully shown its effect on the prices of imported goods, and well-known institutions expect its impact to gradually be reflected in economic data in the coming months. This means that gold's appeal as an anti-inflation and safe-haven asset may continue to increase, while the US dollar may face short-term pressure due to the Fed's cautious attitude and external uncertainties.
US dollar index: oscillates weakly, pay attention to the moving average support
The US dollar index is currently at 98.2742, down 0.38% on the day, reflecting the market's sensitive reaction to the expected adjustment of the Fed's policy. From the daily chart, the US dollar index has fallen below the 50-day moving average (98.7105), and further away from the 100-day moving average (100.3674) and 200-day moving average (103.5833). This shows that the medium- and long-term trend is bearish, and market sentiment tends to be bearish on the US dollar in the short term. The MACD indicator shows that the DIFF value is -0.0617, the DEA is -0.2714, and the MACD value is 0.4184. The fast and slow lines tend to converge, suggesting that the downward momentum has weakened, but no clear rebound signal has yet formed. The RSI indicator is 52.0856, which is in the neutral area, indicating that the market is not overbought or oversold, and the oscillation pattern may continue in the short term.
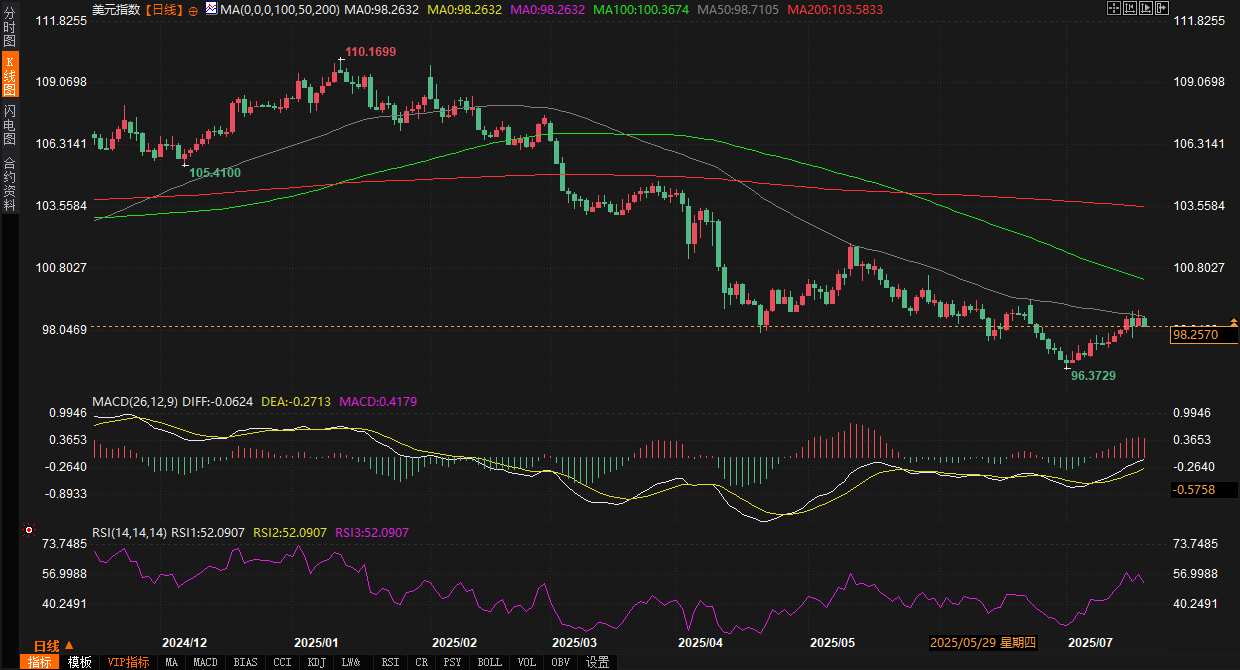
From the perspective of market sentiment, traders generally mentioned that the US dollar index is a key support in the range of 98.0-98.5. If it falls below 98.0, it may further test the year's low near 97.5.
Spot gold: mild upward trend, focus on resistance breakthrough
Spot gold price was reported at $3357.78/oz, up 0.57% on the day, indicating that safe-haven demand and inflation expectations jointly supported higher prices. On the daily chart, gold prices stood above the 50-day moving average (3324.75) and broke through the 100-day moving average (3227.40), showing strong upward momentum. The 200-day moving average (2972.57) is used as a long-term trend reference, indicating that gold is still in a long-term upward channel. The MACD indicator shows that the DIFF value is 3.46, the DEA is 1.96, and the MACD value is 3.00, showing a golden cross state, indicating that the short-term trend is bullish. The RSI is 54.16, close to the overbought area, suggesting that short-term gains may slow down, but the overall momentum is still positive.
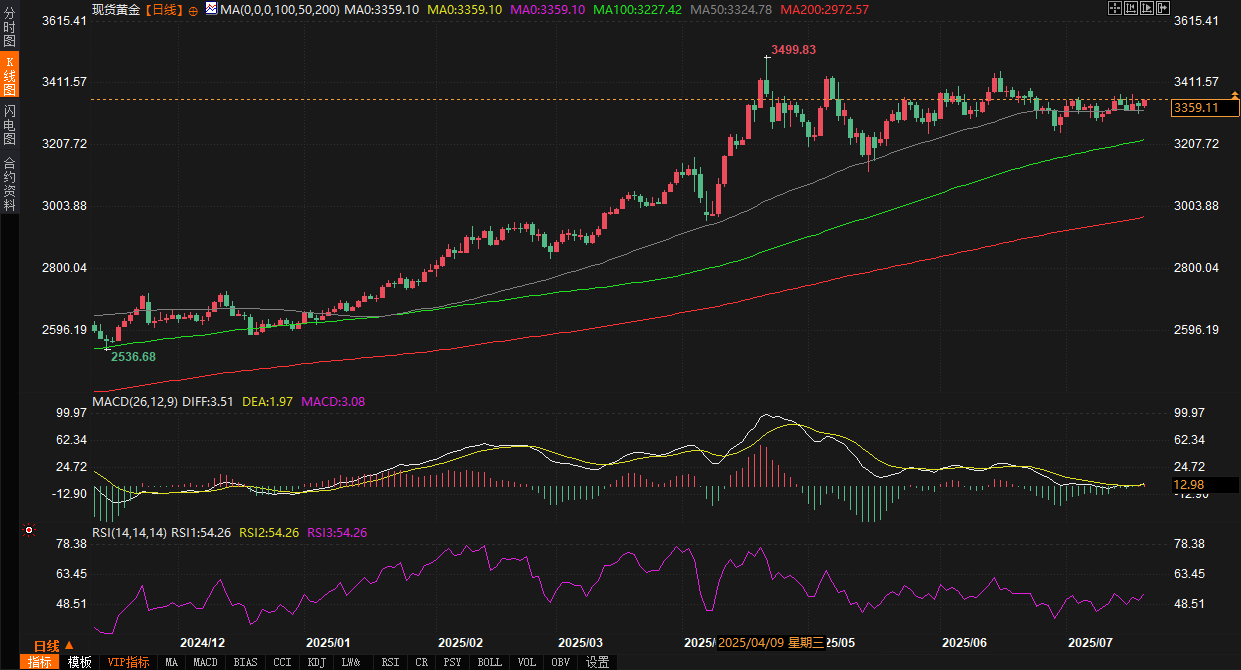
Analysts pointed out that gold is currently facing strong resistance in the 3350-3400 range, and a break above 3400 may open up further upside space. The lower support level is near the 50-day moving average of 3324.75. If the correction does not break this level, the short-term bullish trend is expected to continue. The market's divergence in expectations for the Fed's September rate cut and the potential boost to inflation from tariff policies have provided support for gold prices.
Looking ahead, the trend of the US dollar index and spot gold will continue to diverge under the dual influence of the Fed's policy path and the global macro environment. The US dollar index may fluctuate in the range of 98.0-98.5 in the short term. If inflation data continues to exceed expectations, the possibility of the Fed maintaining high interest rates will further suppress the rebound momentum of the US dollar. From a technical perspective, a break below 98.0 may trigger further downward pressure, while standing above the 50-day moving average (98.7105) may trigger a short-term rebound. For gold, inflationary pressure and safe-haven demand caused by tariff rhetoric will continue to support prices. If it can break through the key resistance of $3,400/ounce in the short term, it may further test the high point of the year. The 50-day moving average (3324.75) below is an important support. If the short-term correction holds this level, the bullish trend will still prevail.
It is important to note that the press conference after the Fed's meeting at the end of July will provide key guidance, especially the chairman's statement on inflation and the timing of interest rate cuts, which may trigger market fluctuations. In addition, employment and inflation data in the next two months will serve as a bellwether for the September meeting, and investors need to pay close attention to the potential impact of changes in these data on the US dollar and gold. In the short term, market uncertainty will continue to drive gold's safe-haven demand, while the trend of the US dollar depends more on the Fed's policy signals and changes in global risk appetite.
This article will combine the latest market data with fundamental dynamics to deeply analyze the impact of the Federal Reserve’s interest rate expectations on the U.S. dollar and gold, and explore short-term trends from a technical perspective.
Fundamental analysis: inflation pressure and policy game
The Fed's current monetary policy is at a critical turning point. The latest data shows that the US CPI inflation rate rose from 2.4% in May to 2.7% in June, exceeding market expectations, while the core CPI (excluding food and energy) climbed to 2.8%. This trend shows that inflationary pressure is shifting from the post-epidemic decline period to a new upward cycle. Well-known institutions have pointed out that the breadth of inflation is expanding, with the annualized increase in prices of nearly half of the commodities reaching more than 5%, doubling from January. This phenomenon is partly attributed to the tariff policy that Trump quickly implemented after taking office. Although the direct price effect of tariffs is theoretically a one-time shock, the current US economic growth is above the trend level and the labor market is still tight, and the upward pressure on prices may be more persistent.
The differences within the Fed on the policy path have further emerged. A Fed governor stressed that current inflation expectations have not yet been fully anchored, and it is crucial to maintain a tight policy to curb inflationary psychology. She expects the personal consumption expenditure (PCE) price index to rise further in the coming months, possibly reaching 2.5% in June, and the core PCE may reach 2.8%. This view is consistent with the statement of the president of the Atlanta Fed, who pointed out that the June inflation data "deviated from the target" and the widespread nature of price pressures was worrying. In contrast, another governor who was mentioned as a potential candidate for the Fed chairman held a different view, believing that the upside risks to inflation are limited, signs of economic slowdown have emerged, and that the meeting at the end of July should consider cutting interest rates to avoid a deterioration in the labor market.
Trump's tariff rhetoric has added an extra layer of complexity to the market. He has recently put pressure on the Federal Reserve to slash interest rates to reduce the cost of financing the federal deficit, but the Fed's mission is to stabilize inflation rather than cooperate with fiscal policy. The market was once volatile due to rumors that Trump might replace the Fed chairman, causing a short-term jump in U.S. Treasury yields and pressure on the U.S. dollar index. Despite this, the Fed's policy outlook has not changed fundamentally, and the probability of keeping interest rates unchanged at the July meeting is close to 100%. The market focus has shifted to the September meeting, where investors expect a 25 basis point rate cut, but the latest inflation data has lowered this probability from a high level to close to 50%.
The continued tension between Russia and Ukraine and the uncertainty of the global supply chain have further boosted risk aversion, benefiting spot gold. The tariff policy has not yet fully shown its effect on the prices of imported goods, and well-known institutions expect its impact to gradually be reflected in economic data in the coming months. This means that gold's appeal as an anti-inflation and safe-haven asset may continue to increase, while the US dollar may face short-term pressure due to the Fed's cautious attitude and external uncertainties.
Technical analysis: Interpretation of the US dollar and gold
US dollar index: oscillates weakly, pay attention to the moving average support
The US dollar index is currently at 98.2742, down 0.38% on the day, reflecting the market's sensitive reaction to the expected adjustment of the Fed's policy. From the daily chart, the US dollar index has fallen below the 50-day moving average (98.7105), and further away from the 100-day moving average (100.3674) and 200-day moving average (103.5833). This shows that the medium- and long-term trend is bearish, and market sentiment tends to be bearish on the US dollar in the short term. The MACD indicator shows that the DIFF value is -0.0617, the DEA is -0.2714, and the MACD value is 0.4184. The fast and slow lines tend to converge, suggesting that the downward momentum has weakened, but no clear rebound signal has yet formed. The RSI indicator is 52.0856, which is in the neutral area, indicating that the market is not overbought or oversold, and the oscillation pattern may continue in the short term.
From the perspective of market sentiment, traders generally mentioned that the US dollar index is a key support in the range of 98.0-98.5. If it falls below 98.0, it may further test the year's low near 97.5.
Spot gold: mild upward trend, focus on resistance breakthrough
Spot gold price was reported at $3357.78/oz, up 0.57% on the day, indicating that safe-haven demand and inflation expectations jointly supported higher prices. On the daily chart, gold prices stood above the 50-day moving average (3324.75) and broke through the 100-day moving average (3227.40), showing strong upward momentum. The 200-day moving average (2972.57) is used as a long-term trend reference, indicating that gold is still in a long-term upward channel. The MACD indicator shows that the DIFF value is 3.46, the DEA is 1.96, and the MACD value is 3.00, showing a golden cross state, indicating that the short-term trend is bullish. The RSI is 54.16, close to the overbought area, suggesting that short-term gains may slow down, but the overall momentum is still positive.
Analysts pointed out that gold is currently facing strong resistance in the 3350-3400 range, and a break above 3400 may open up further upside space. The lower support level is near the 50-day moving average of 3324.75. If the correction does not break this level, the short-term bullish trend is expected to continue. The market's divergence in expectations for the Fed's September rate cut and the potential boost to inflation from tariff policies have provided support for gold prices.
Future Trend Outlook
Looking ahead, the trend of the US dollar index and spot gold will continue to diverge under the dual influence of the Fed's policy path and the global macro environment. The US dollar index may fluctuate in the range of 98.0-98.5 in the short term. If inflation data continues to exceed expectations, the possibility of the Fed maintaining high interest rates will further suppress the rebound momentum of the US dollar. From a technical perspective, a break below 98.0 may trigger further downward pressure, while standing above the 50-day moving average (98.7105) may trigger a short-term rebound. For gold, inflationary pressure and safe-haven demand caused by tariff rhetoric will continue to support prices. If it can break through the key resistance of $3,400/ounce in the short term, it may further test the high point of the year. The 50-day moving average (3324.75) below is an important support. If the short-term correction holds this level, the bullish trend will still prevail.
It is important to note that the press conference after the Fed's meeting at the end of July will provide key guidance, especially the chairman's statement on inflation and the timing of interest rate cuts, which may trigger market fluctuations. In addition, employment and inflation data in the next two months will serve as a bellwether for the September meeting, and investors need to pay close attention to the potential impact of changes in these data on the US dollar and gold. In the short term, market uncertainty will continue to drive gold's safe-haven demand, while the trend of the US dollar depends more on the Fed's policy signals and changes in global risk appetite.
- Risk Warning and Disclaimer
- The market involves risk, and trading may not be suitable for all investors. This article is for reference only and does not constitute personal investment advice, nor does it take into account certain users’ specific investment objectives, financial situation, or other needs. Any investment decisions made based on this information are at your own risk.