Trump's "letter of pressure" caused market anxiety, and the direction of gold is approaching
2025-07-04 21:46:33
On Friday (July 4), spot gold (XAU/USD) remained volatile and strong against the backdrop of insufficient liquidity during the U.S. Independence Day holiday, trading around $3,330 in the evening. Previously, the passage of the "Great Beauty Act" and Trump's foreign trade stance triggered market concerns about geopolitical and fiscal risks, and gold prices were supported for a time.

In the United States, the "Big Beautiful Act" passed by the House of Representatives on Thursday night gave a short boost to market sentiment. The market generally believes that the bill may promote further tax cuts and increase fiscal spending. However, the bill involves raising the debt ceiling by $5 trillion, while the deficit will expand by $3.3 trillion over the next decade, which has triggered deep concerns about the sustainability of US debt.
At the same time, Trump once again sent a tough signal, saying that he would send letters to many countries one by one, demanding a clear payment ratio in exchange for business dealings with the United States, and mentioned that the tariff level may be as high as 70%. Although the US non-farm data exceeded expectations (147,000 new jobs and the unemployment rate dropped to 4.1%), which boosted the US dollar and US bond yields in the short term, the market's concerns about long-term fiscal structural risks are heating up, increasing the attractiveness of gold allocation.
The current gold daily chart is running below the middle track of the Bollinger Band (3348.09), showing a short-term consolidation pattern. Analysts believe that the upper resistance level is concentrated in the previous high range of US$3,400 and US$3,451, forming an obvious rectangular consolidation range; the key support level below is US$3,250, which may trigger a new round of decline if it is effectively broken.
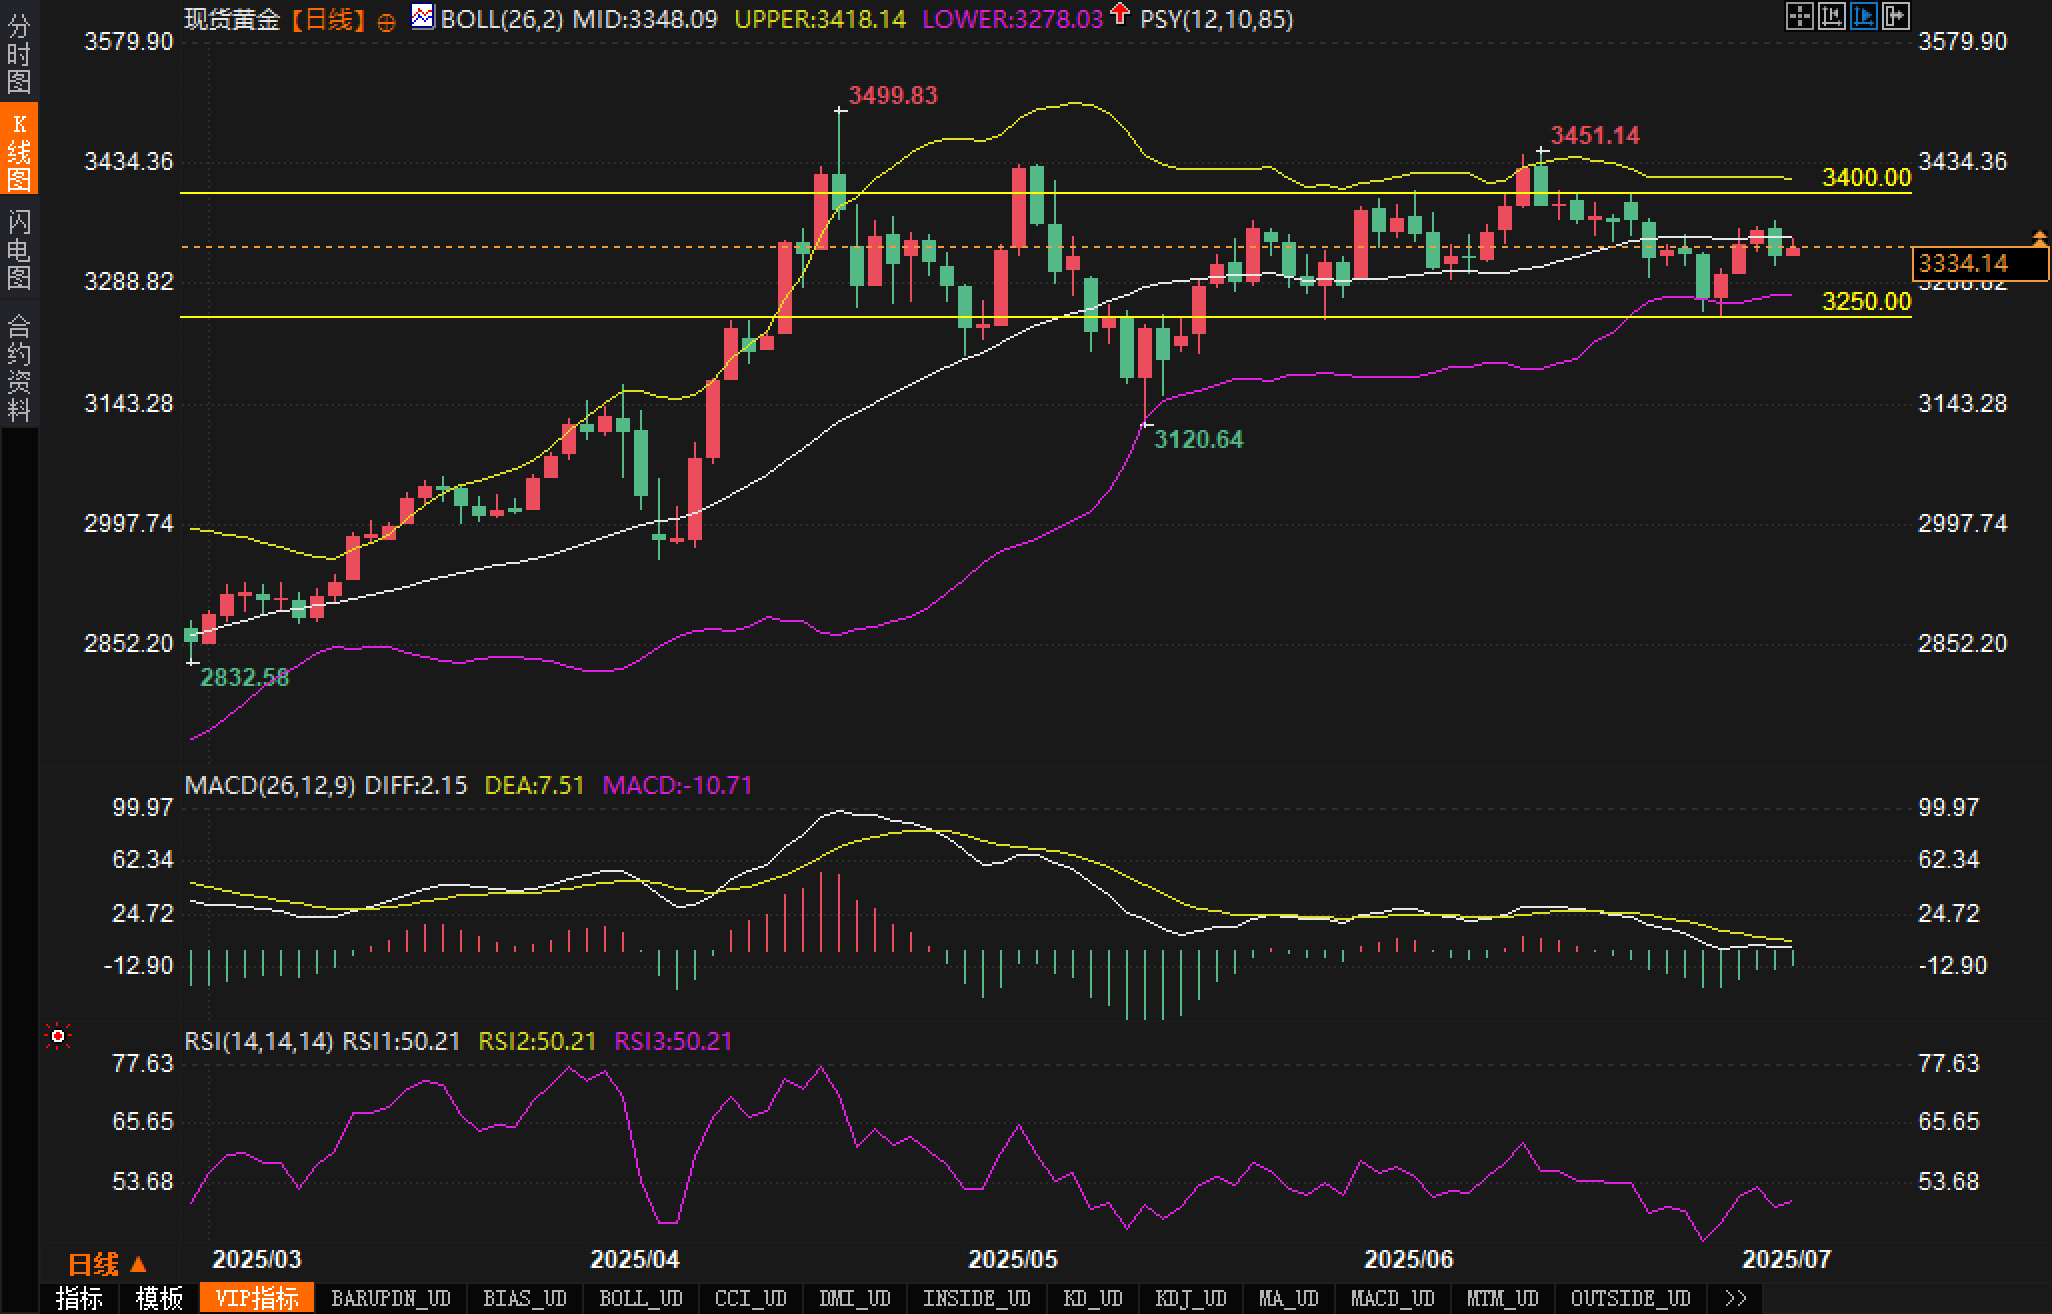
From the K-line pattern, the price has failed to test the pressure of the Bollinger middle track many times recently, forming a small yin-yang staggered arrangement, indicating that the long and short positions are fierce. The Bollinger bands show obvious signs of closing, indicating that volatility is in a state of contraction, and a direction choice may be brewing in the short term.
In terms of MACD indicators, DIFF and DEA run in a glued manner, and the histogram remains below the zero axis. No effective golden cross or dead cross has appeared yet, indicating that the trend is still weak. RSI remains at the 50 level, indicating that the market is not obviously overbought or oversold, and it is necessary to wait patiently for a breakthrough in the direction.
Overall, although risk appetite briefly increased this week due to positive signals from trade negotiations, market risk aversion rose again as Trump's tough remarks and "letter-based taxation" plan were exposed. The stabilization of U.S. bond yields and the short-term rebound of the U.S. dollar temporarily slowed the upward pace of gold, but from the perspective of fund inflows into ETFs and futures positions, gold still has certain risk aversion support.
In addition, the Congressional Budget Office's warning on the US deficit and the market's expectation of the Federal Reserve's interest rate cut in September have intertwined, causing gold to enter a typical emotional game range. Analysts believe that the current market sentiment is neutral to positive, and although the transaction volume has not increased significantly, there are still signs of marginal capital inflows.
Short-term outlook:
Analysts believe that if the gold price can successfully break through the key resistance of $3,400 and stabilize, it may open up room for a rebound to $3,450 or even $3,499. On the contrary, if it breaks below $3,250, it may retrace to the previous low of $3,120, and the market will enter a short-selling test phase.
Mid- to long-term outlook:
The fiscal deficit risk and high debt structural problems in the United States may continue to ferment, and combined with the potential easing expectations within the year, will provide medium- and long-term support for gold. However, analysts believe that if the Federal Reserve delays interest rate cuts or inflation rebounds faster than expected, gold should be alert to the pressure of liquidity withdrawal and yield recovery.
In the United States, the "Big Beautiful Act" passed by the House of Representatives on Thursday night gave a short boost to market sentiment. The market generally believes that the bill may promote further tax cuts and increase fiscal spending. However, the bill involves raising the debt ceiling by $5 trillion, while the deficit will expand by $3.3 trillion over the next decade, which has triggered deep concerns about the sustainability of US debt.
At the same time, Trump once again sent a tough signal, saying that he would send letters to many countries one by one, demanding a clear payment ratio in exchange for business dealings with the United States, and mentioned that the tariff level may be as high as 70%. Although the US non-farm data exceeded expectations (147,000 new jobs and the unemployment rate dropped to 4.1%), which boosted the US dollar and US bond yields in the short term, the market's concerns about long-term fiscal structural risks are heating up, increasing the attractiveness of gold allocation.
Technical aspects:
The current gold daily chart is running below the middle track of the Bollinger Band (3348.09), showing a short-term consolidation pattern. Analysts believe that the upper resistance level is concentrated in the previous high range of US$3,400 and US$3,451, forming an obvious rectangular consolidation range; the key support level below is US$3,250, which may trigger a new round of decline if it is effectively broken.
From the K-line pattern, the price has failed to test the pressure of the Bollinger middle track many times recently, forming a small yin-yang staggered arrangement, indicating that the long and short positions are fierce. The Bollinger bands show obvious signs of closing, indicating that volatility is in a state of contraction, and a direction choice may be brewing in the short term.
In terms of MACD indicators, DIFF and DEA run in a glued manner, and the histogram remains below the zero axis. No effective golden cross or dead cross has appeared yet, indicating that the trend is still weak. RSI remains at the 50 level, indicating that the market is not obviously overbought or oversold, and it is necessary to wait patiently for a breakthrough in the direction.
Market sentiment observation
Overall, although risk appetite briefly increased this week due to positive signals from trade negotiations, market risk aversion rose again as Trump's tough remarks and "letter-based taxation" plan were exposed. The stabilization of U.S. bond yields and the short-term rebound of the U.S. dollar temporarily slowed the upward pace of gold, but from the perspective of fund inflows into ETFs and futures positions, gold still has certain risk aversion support.
In addition, the Congressional Budget Office's warning on the US deficit and the market's expectation of the Federal Reserve's interest rate cut in September have intertwined, causing gold to enter a typical emotional game range. Analysts believe that the current market sentiment is neutral to positive, and although the transaction volume has not increased significantly, there are still signs of marginal capital inflows.
Outlook
Short-term outlook:
Analysts believe that if the gold price can successfully break through the key resistance of $3,400 and stabilize, it may open up room for a rebound to $3,450 or even $3,499. On the contrary, if it breaks below $3,250, it may retrace to the previous low of $3,120, and the market will enter a short-selling test phase.
Mid- to long-term outlook:
The fiscal deficit risk and high debt structural problems in the United States may continue to ferment, and combined with the potential easing expectations within the year, will provide medium- and long-term support for gold. However, analysts believe that if the Federal Reserve delays interest rate cuts or inflation rebounds faster than expected, gold should be alert to the pressure of liquidity withdrawal and yield recovery.
- Risk Warning and Disclaimer
- The market involves risk, and trading may not be suitable for all investors. This article is for reference only and does not constitute personal investment advice, nor does it take into account certain users’ specific investment objectives, financial situation, or other needs. Any investment decisions made based on this information are at your own risk.