The gold price suddenly stopped after rising 1.91% during the week! Is $3375 an "air force defense line" or a "bullish springboard"?
2025-07-05 20:57:40
This week (June 30 to July 4), the spot gold market experienced significant fluctuations, with prices correcting after hitting a new high, ultimately recording a weekly gain of 1.91%. The easing of geopolitical risks, uncertainty in Trump's tariff policy, concerns about US sovereign debt, and strong economic data have jointly shaped the trend of gold prices. The market focus is on US non-farm payrolls data, the expiring Trump tariff suspension period, and the outlook for Fed policy. Technical analysis shows that gold prices are in a short-term consolidation phase, with long and short forces in a stalemate. Future directional breakthroughs need to focus on key technical points and the progress of macro events. This article will review the trend of the gold market this week, summarize relevant economic data and events, and sort out the views of analysts and institutions.

This week, the spot gold price showed a trend of rising first and then falling. From Monday to Wednesday, driven by safe-haven demand and the weakness of the US dollar, the gold price recorded three consecutive increases, climbing rapidly from $3,271/ounce to the intraday high of $3,365/ounce on Wednesday afternoon, showing strong upward momentum. However, before the release of the June non-farm payrolls data on Thursday, market sentiment turned and the gold price plummeted to $3,312/ounce, the largest single-day drop in the week. On Friday, affected by the light trading during the US Independence Day holiday, the gold price fluctuated between $3,330 and $3,355/ounce, closing at around $3,337/ounce, up about 1.91% for the week.
Behind the fluctuation of gold prices, the game between safe-haven demand and economic data performance is the main driving factor. The tariff policy promoted by Trump has caused market concerns about global trade and economic growth. Coupled with the continued rise in US sovereign debt, it has supported the safe-haven appeal of gold. However, strong non-farm payrolls data has reduced expectations of a rate cut by the Federal Reserve, and the US dollar index has stabilized at a low level, limiting the further upside of gold prices. In addition, expectations of easing the conflict between Russia and Ukraine have weakened the geopolitical risk premium, and gold prices tend to fluctuate in the short term.
1. US non-farm payrolls data exceeded expectations
The June U.S. non-farm payrolls data released on July 3 showed that 147,000 new jobs were created, exceeding the market expectation of 111,000, and the unemployment rate dropped to 4.1%. This strong data weakened the market's expectations for the Fed to cut interest rates in July. The U.S. dollar index rebounded from a multi-year low of around 97, and gold prices fell significantly on Thursday. The market currently expects the probability of the Fed cutting interest rates to drop to 25%, which puts short-term pressure on gold prices.
2. Uncertainty of Trump's tariff policy <br/>The 90-day tariff suspension promoted by Trump will expire on July 9, and the United States plans to send letters to various countries to clarify the tariff rates on exported goods. This policy has triggered market risk aversion towards global trade and economic growth, supporting the demand for gold as a safe-haven asset. However, the uncertainty of tariff policies has also led to increased market volatility, and gold prices have been under pressure at high levels.
3. US debt problem and fiscal policy <br/>On July 3, the US Congress passed the tax reform bill promoted by Trump, which made the 2017 tax reform policy permanent and added a number of tax incentives while cutting funding for medical and green energy projects. According to the Congressional Budget Office (CBO), the bill will increase the federal deficit by $3.4 trillion over the next 10 years, and the total US national debt has exceeded $37 trillion. The continued rise in sovereign debt has weakened the attractiveness of the US dollar and supported the medium- and long-term upward trend of gold.
4. Geopolitical tensions eased <br/>The conflict between Russia and Ukraine showed signs of easing this week, and the market's concerns about geopolitical risks have declined. The decline in risk premium has put some pressure on gold prices. In addition, the progress of the Iran nuclear talks has also reduced tensions in the Middle East, further weakening the short-term safe-haven demand for gold.
5. Upcoming key events <br/>Next week, the market will usher in a number of important events, including the Reserve Bank of Australia's monetary policy decision (July 8), the Federal Reserve's June FOMC meeting minutes (July 9), and the US weekly initial jobless claims data (July 10). These events may provide the market with clues about monetary policy and economic prospects, affecting the trend of gold prices.
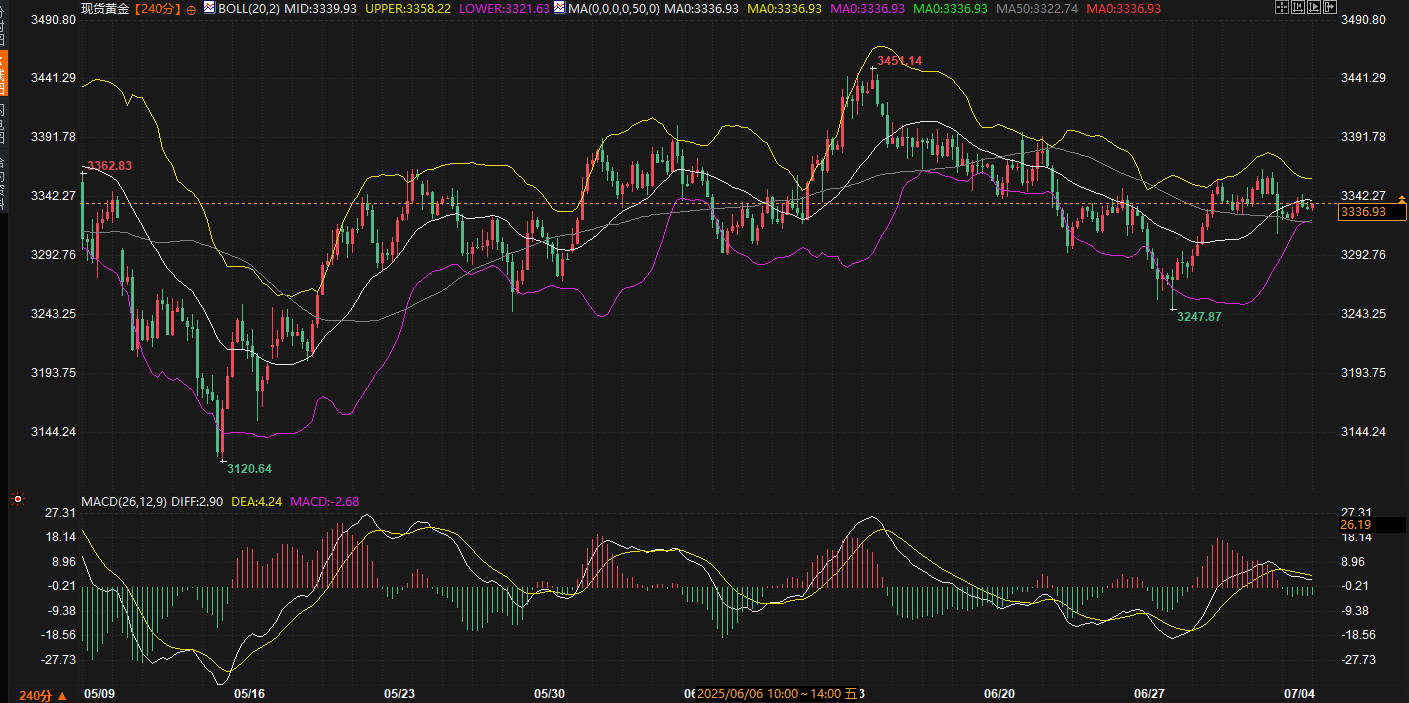
The daily chart of spot gold shows that the Bollinger Bands are in a closed state, with the upper track at $3402.90/ounce, the middle track at $3375.58/ounce, and the lower track at $3348.27/ounce. The current price of $3336.93/ounce is close to the lower track, indicating that the short-term trend is weak. The 50-period moving average (3376.86 US dollars/ounce) has a significant suppression on the price. The MACD indicator (DIFF=-8.09, DEA=-4.51, MACD=-7.17) is below the zero axis and the DIFF line continues to decline, confirming the short trend. However, the absolute value of the MACD bar has narrowed marginally, suggesting that the short momentum may weaken. In the short term, we need to pay attention to the breakthrough of $3375.58/ounce (middle track). If it stands firm, it may open up rebound space; if it falls below $3348.27/ounce (lower track), it may further decline.
1. Ole Hansen, head of commodity strategy at Saxo Bank
Ole Hansen said that the decline in gold prices after the release of non-farm data is in line with the market's reaction to the Fed's adjustment of its expectations for rate cuts. He believes that gold needs further confirmation of the prospect of rate cuts to break through the current range of fluctuations, but the medium- and long-term upward trend remains unchanged. He suggested paying attention to the support level of $3,250/ounce. If it can be maintained, a technical correction can be avoided and a bullish outlook can be maintained.
2. James Stanley, Senior Market Strategist
James Stanley is optimistic about gold and believes that short-term corrections are buying opportunities. He pointed out that the continued deficit spending and currency depreciation trends of global governments will support gold prices in the long term, and it is expected that gold prices may return to the high of $3,500 per ounce by the end of the year.
3. Michael Brown, Senior Market Analyst, Pepperstone
Michael Brown believes that the downward trend of the US dollar and the trend of global reserve managers increasing their gold holdings will continue to support gold prices. He sees the current market as a "buy on dips" opportunity and expects gold prices to hit $3,500 an ounce by the end of the year.
4. HSBC
In a report released on July 3, HSBC raised its gold price forecast for 2025 from $3,015/ounce to $3,215/ounce, and its forecast for 2026 is $3,125/ounce. The agency expects gold prices to fluctuate between $3,100 and $3,600/ounce, and prices could reach $3,175/ounce by the end of the year. HSBC also pointed out that wealthy investors have increased interest in gold, and gold ETF inflows have hit a new high since 2020, indicating strong investment demand.
This week, the spot gold market recorded a weekly gain of 1.91% under the combined influence of safe-haven demand, a weak dollar and strong economic data. The uncertainty of Trump's tariff policy and the rise of US sovereign debt provided support for gold prices, but strong non-farm payrolls and easing geopolitical risks limited the upside. Technical analysis shows that gold prices are in a short-term consolidation phase, and the breakthrough of key points (US$3339.93 to US$3358.22/oz) will determine the subsequent direction. The market is paying attention to the Reserve Bank of Australia's monetary policy decision, the FOMC meeting minutes and the US initial jobless claims data next week, which may provide new impetus for gold prices.
Looking ahead, the specific implementation of Trump's tariff policy, the Federal Reserve's monetary policy path, and the prospects for global economic recovery will be the core drivers of gold prices. Investors need to pay close attention to the trend of the US dollar index and key technical points, while being alert to market sentiment fluctuations caused by geopolitical and trade policies. In the short term, gold prices may fluctuate in the range of $3,300 to $3,400 per ounce, and traders should remain cautious and wait for clear breakthrough signals.
Review of gold market trends this week
This week, the spot gold price showed a trend of rising first and then falling. From Monday to Wednesday, driven by safe-haven demand and the weakness of the US dollar, the gold price recorded three consecutive increases, climbing rapidly from $3,271/ounce to the intraday high of $3,365/ounce on Wednesday afternoon, showing strong upward momentum. However, before the release of the June non-farm payrolls data on Thursday, market sentiment turned and the gold price plummeted to $3,312/ounce, the largest single-day drop in the week. On Friday, affected by the light trading during the US Independence Day holiday, the gold price fluctuated between $3,330 and $3,355/ounce, closing at around $3,337/ounce, up about 1.91% for the week.
Behind the fluctuation of gold prices, the game between safe-haven demand and economic data performance is the main driving factor. The tariff policy promoted by Trump has caused market concerns about global trade and economic growth. Coupled with the continued rise in US sovereign debt, it has supported the safe-haven appeal of gold. However, strong non-farm payrolls data has reduced expectations of a rate cut by the Federal Reserve, and the US dollar index has stabilized at a low level, limiting the further upside of gold prices. In addition, expectations of easing the conflict between Russia and Ukraine have weakened the geopolitical risk premium, and gold prices tend to fluctuate in the short term.
Relevant economic data and events
1. US non-farm payrolls data exceeded expectations
The June U.S. non-farm payrolls data released on July 3 showed that 147,000 new jobs were created, exceeding the market expectation of 111,000, and the unemployment rate dropped to 4.1%. This strong data weakened the market's expectations for the Fed to cut interest rates in July. The U.S. dollar index rebounded from a multi-year low of around 97, and gold prices fell significantly on Thursday. The market currently expects the probability of the Fed cutting interest rates to drop to 25%, which puts short-term pressure on gold prices.
2. Uncertainty of Trump's tariff policy <br/>The 90-day tariff suspension promoted by Trump will expire on July 9, and the United States plans to send letters to various countries to clarify the tariff rates on exported goods. This policy has triggered market risk aversion towards global trade and economic growth, supporting the demand for gold as a safe-haven asset. However, the uncertainty of tariff policies has also led to increased market volatility, and gold prices have been under pressure at high levels.
3. US debt problem and fiscal policy <br/>On July 3, the US Congress passed the tax reform bill promoted by Trump, which made the 2017 tax reform policy permanent and added a number of tax incentives while cutting funding for medical and green energy projects. According to the Congressional Budget Office (CBO), the bill will increase the federal deficit by $3.4 trillion over the next 10 years, and the total US national debt has exceeded $37 trillion. The continued rise in sovereign debt has weakened the attractiveness of the US dollar and supported the medium- and long-term upward trend of gold.
4. Geopolitical tensions eased <br/>The conflict between Russia and Ukraine showed signs of easing this week, and the market's concerns about geopolitical risks have declined. The decline in risk premium has put some pressure on gold prices. In addition, the progress of the Iran nuclear talks has also reduced tensions in the Middle East, further weakening the short-term safe-haven demand for gold.
5. Upcoming key events <br/>Next week, the market will usher in a number of important events, including the Reserve Bank of Australia's monetary policy decision (July 8), the Federal Reserve's June FOMC meeting minutes (July 9), and the US weekly initial jobless claims data (July 10). These events may provide the market with clues about monetary policy and economic prospects, affecting the trend of gold prices.
Technical Analysis
The daily chart of spot gold shows that the Bollinger Bands are in a closed state, with the upper track at $3402.90/ounce, the middle track at $3375.58/ounce, and the lower track at $3348.27/ounce. The current price of $3336.93/ounce is close to the lower track, indicating that the short-term trend is weak. The 50-period moving average (3376.86 US dollars/ounce) has a significant suppression on the price. The MACD indicator (DIFF=-8.09, DEA=-4.51, MACD=-7.17) is below the zero axis and the DIFF line continues to decline, confirming the short trend. However, the absolute value of the MACD bar has narrowed marginally, suggesting that the short momentum may weaken. In the short term, we need to pay attention to the breakthrough of $3375.58/ounce (middle track). If it stands firm, it may open up rebound space; if it falls below $3348.27/ounce (lower track), it may further decline.
Analyst and Institutional Views
1. Ole Hansen, head of commodity strategy at Saxo Bank
Ole Hansen said that the decline in gold prices after the release of non-farm data is in line with the market's reaction to the Fed's adjustment of its expectations for rate cuts. He believes that gold needs further confirmation of the prospect of rate cuts to break through the current range of fluctuations, but the medium- and long-term upward trend remains unchanged. He suggested paying attention to the support level of $3,250/ounce. If it can be maintained, a technical correction can be avoided and a bullish outlook can be maintained.
2. James Stanley, Senior Market Strategist
James Stanley is optimistic about gold and believes that short-term corrections are buying opportunities. He pointed out that the continued deficit spending and currency depreciation trends of global governments will support gold prices in the long term, and it is expected that gold prices may return to the high of $3,500 per ounce by the end of the year.
3. Michael Brown, Senior Market Analyst, Pepperstone
Michael Brown believes that the downward trend of the US dollar and the trend of global reserve managers increasing their gold holdings will continue to support gold prices. He sees the current market as a "buy on dips" opportunity and expects gold prices to hit $3,500 an ounce by the end of the year.
4. HSBC
In a report released on July 3, HSBC raised its gold price forecast for 2025 from $3,015/ounce to $3,215/ounce, and its forecast for 2026 is $3,125/ounce. The agency expects gold prices to fluctuate between $3,100 and $3,600/ounce, and prices could reach $3,175/ounce by the end of the year. HSBC also pointed out that wealthy investors have increased interest in gold, and gold ETF inflows have hit a new high since 2020, indicating strong investment demand.
Summary and Outlook
This week, the spot gold market recorded a weekly gain of 1.91% under the combined influence of safe-haven demand, a weak dollar and strong economic data. The uncertainty of Trump's tariff policy and the rise of US sovereign debt provided support for gold prices, but strong non-farm payrolls and easing geopolitical risks limited the upside. Technical analysis shows that gold prices are in a short-term consolidation phase, and the breakthrough of key points (US$3339.93 to US$3358.22/oz) will determine the subsequent direction. The market is paying attention to the Reserve Bank of Australia's monetary policy decision, the FOMC meeting minutes and the US initial jobless claims data next week, which may provide new impetus for gold prices.
Looking ahead, the specific implementation of Trump's tariff policy, the Federal Reserve's monetary policy path, and the prospects for global economic recovery will be the core drivers of gold prices. Investors need to pay close attention to the trend of the US dollar index and key technical points, while being alert to market sentiment fluctuations caused by geopolitical and trade policies. In the short term, gold prices may fluctuate in the range of $3,300 to $3,400 per ounce, and traders should remain cautious and wait for clear breakthrough signals.
- Risk Warning and Disclaimer
- The market involves risk, and trading may not be suitable for all investors. This article is for reference only and does not constitute personal investment advice, nor does it take into account certain users’ specific investment objectives, financial situation, or other needs. Any investment decisions made based on this information are at your own risk.