Technical Analysis: The US dollar index fell sharply after the release of US labor market data
2025-08-04 18:59:24
The dollar found some support on Monday (August 4) after a dismal U.S. jobs report and Trump's firing of a senior Labor Department official. Last week's non-farm payroll data shocked investors and led them to increase bets on an imminent Federal Reserve interest rate cut, which hit the dollar on Friday.

"The report itself may not be that weak, but the revisions are very large," said Mohamad Al-Saraf, a currency strategist at Danske Bank. "It's hard for us to imagine the Fed standing pat at its September meeting."
Adding to the market's woes, Trump fired Bureau of Labor Statistics Commissioner Erika McEntarfer the same day, accusing her of falsifying employment data.
The U.S. dollar index (DXY) fell about 1.4% on Friday after the release of disappointing U.S. labor market data.
Data released last Friday showed that the non-farm payrolls change in July was 73,000, far below the 103,000 expected. This is the lowest level of non-farm payrolls added in 2025 and is about half of the previous month's (unrevised) data.
Furthermore, the data for May and June saw much larger revisions than usual. May's data was revised down by 125,000, from +144,000 to +19,000. Similarly, June's data was revised down by 133,000, from +147,000 to +14,000.
These results suggest a weakening labor market, increasing the likelihood of an interest rate cut to support economic growth. In turn, expectations of a Fed rate cut are acting as a bearish driver for the dollar.
Technical Analysis
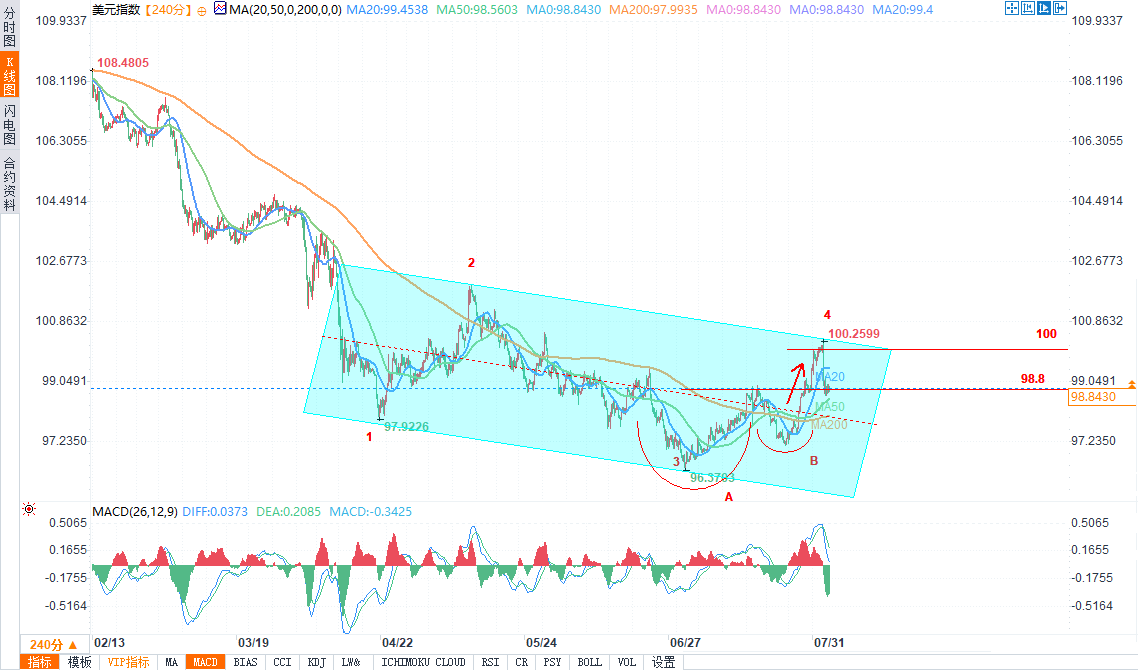
(Source: 4-hour chart of the US dollar index: Yihuitong)
Six days ago, we highlighted two U-shaped trajectories (A and B) that together formed a bullish “cup with handle” pattern on the US Dollar Index chart.
Since then, the price action has generated significant upward momentum (as indicated by the arrow), breaking through the upper boundary of the pattern.
However, Friday's news triggered the following moves:
A new high (4) was formed on the chart, accompanied by a false breakout of the psychological level of 100.00;
The price fell to the 98.80 area. Downward momentum slowed here, as this area had previously seen strong bullish activity on a breakout of the pattern's upper boundary – which may explain why the market found support here on Monday morning.
Overall, the technical outlook has turned bearish. Friday's high continues the series of lower highs and lows from the summer: 1 → 2 → pattern bottom (A) → 4. This structure is part of the overall market downtrend into 2025.
If the bearish sentiment persists, driven by last Friday’s data, we can speculate that the US Dollar Index will fall further to the middle line of the descending channel (shown in red), which is drawn through the aforementioned price extremes.
"The report itself may not be that weak, but the revisions are very large," said Mohamad Al-Saraf, a currency strategist at Danske Bank. "It's hard for us to imagine the Fed standing pat at its September meeting."
Adding to the market's woes, Trump fired Bureau of Labor Statistics Commissioner Erika McEntarfer the same day, accusing her of falsifying employment data.
The U.S. dollar index (DXY) fell about 1.4% on Friday after the release of disappointing U.S. labor market data.
Data released last Friday showed that the non-farm payrolls change in July was 73,000, far below the 103,000 expected. This is the lowest level of non-farm payrolls added in 2025 and is about half of the previous month's (unrevised) data.
Furthermore, the data for May and June saw much larger revisions than usual. May's data was revised down by 125,000, from +144,000 to +19,000. Similarly, June's data was revised down by 133,000, from +147,000 to +14,000.
These results suggest a weakening labor market, increasing the likelihood of an interest rate cut to support economic growth. In turn, expectations of a Fed rate cut are acting as a bearish driver for the dollar.
Technical Analysis
(Source: 4-hour chart of the US dollar index: Yihuitong)
Six days ago, we highlighted two U-shaped trajectories (A and B) that together formed a bullish “cup with handle” pattern on the US Dollar Index chart.
Since then, the price action has generated significant upward momentum (as indicated by the arrow), breaking through the upper boundary of the pattern.
However, Friday's news triggered the following moves:
A new high (4) was formed on the chart, accompanied by a false breakout of the psychological level of 100.00;
The price fell to the 98.80 area. Downward momentum slowed here, as this area had previously seen strong bullish activity on a breakout of the pattern's upper boundary – which may explain why the market found support here on Monday morning.
Overall, the technical outlook has turned bearish. Friday's high continues the series of lower highs and lows from the summer: 1 → 2 → pattern bottom (A) → 4. This structure is part of the overall market downtrend into 2025.
If the bearish sentiment persists, driven by last Friday’s data, we can speculate that the US Dollar Index will fall further to the middle line of the descending channel (shown in red), which is drawn through the aforementioned price extremes.
- Risk Warning and Disclaimer
- The market involves risk, and trading may not be suitable for all investors. This article is for reference only and does not constitute personal investment advice, nor does it take into account certain users’ specific investment objectives, financial situation, or other needs. Any investment decisions made based on this information are at your own risk.