Technical Analysis: GBP/USD attempts a rebound, can it break through the resistance ahead?
2025-08-06 18:44:14
The GBP/USD pair started a new decline below the 1.3450 level. Before the bulls entered the market, the GBP/USD pair fell below 1.3250.
Looking at the 4-hour chart, the pair tested the 1.3140 level and settled below the 100-period SMA and the 200-period SMA.
After forming a low at 1.3139, the pair is currently trying to rebound, breaking through the 1.3250 level and conquering the downward trend connecting line with resistance at 1.3280.
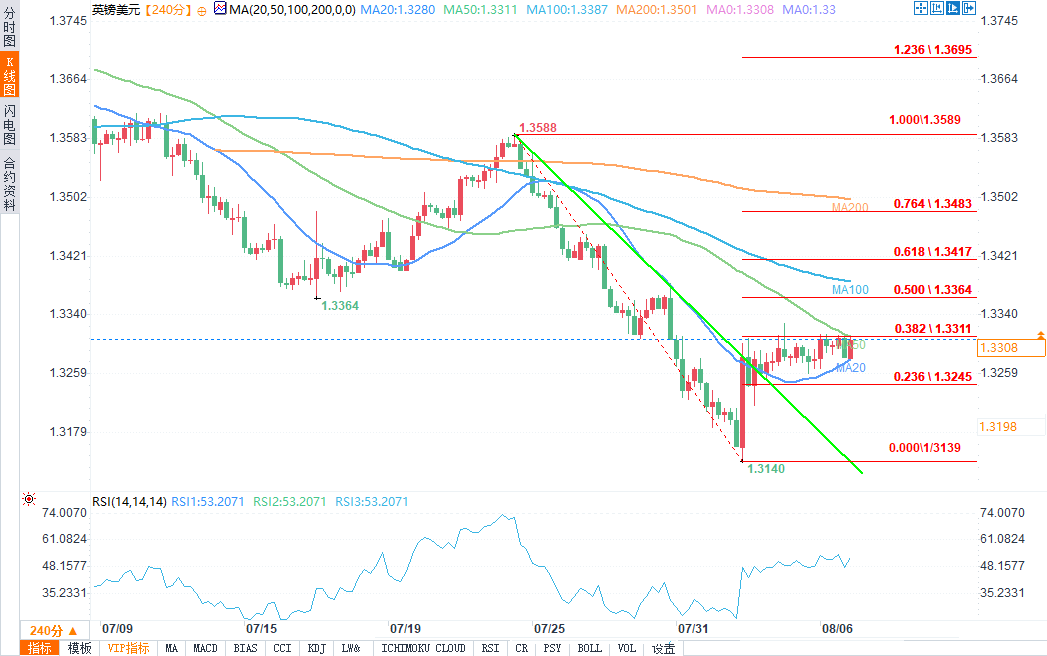
(GBP/USD 4-hour chart source: Yihuitong)
The pair also broke through the 23.6% Fibonacci retracement level of the downward move from the 1.3589 high to the 1.3139 low. On the upside, the pair is currently facing resistance near the 1.3320 level, with the next key resistance near the 1.3400 level and the 100-period moving average.
A close above the 1.3400 level could set the stage for further gains. In this case, GBP/USD could rise to the 1.3480 resistance level, or the 76.4% Fibonacci retracement level of the decline from the 1.3589 high to the 1.3139 low. The next major target for bulls could be around the 1.3550 resistance level.
On the downside, initial support is around 1.3250 level, and the next key support is around 1.3220. If the decline continues, the currency pair may move towards the 1.3150 support area.
Looking at EUR/USD, although the pair has started to rebound, the bears are likely to remain active around the 1.1620 resistance area.
Upcoming economic events
At 02:00 Beijing time on Thursday, Federal Reserve official Collins spoke
At 02:00 Beijing time on Thursday, Federal Reserve official Cook spoke
At 18:39 Beijing time, GBP/USD was at 1.3309/10, up 0.10%.
Looking at the 4-hour chart, the pair tested the 1.3140 level and settled below the 100-period SMA and the 200-period SMA.
After forming a low at 1.3139, the pair is currently trying to rebound, breaking through the 1.3250 level and conquering the downward trend connecting line with resistance at 1.3280.
(GBP/USD 4-hour chart source: Yihuitong)
The pair also broke through the 23.6% Fibonacci retracement level of the downward move from the 1.3589 high to the 1.3139 low. On the upside, the pair is currently facing resistance near the 1.3320 level, with the next key resistance near the 1.3400 level and the 100-period moving average.
A close above the 1.3400 level could set the stage for further gains. In this case, GBP/USD could rise to the 1.3480 resistance level, or the 76.4% Fibonacci retracement level of the decline from the 1.3589 high to the 1.3139 low. The next major target for bulls could be around the 1.3550 resistance level.
On the downside, initial support is around 1.3250 level, and the next key support is around 1.3220. If the decline continues, the currency pair may move towards the 1.3150 support area.
Looking at EUR/USD, although the pair has started to rebound, the bears are likely to remain active around the 1.1620 resistance area.
Upcoming economic events
At 02:00 Beijing time on Thursday, Federal Reserve official Collins spoke
At 02:00 Beijing time on Thursday, Federal Reserve official Cook spoke
At 18:39 Beijing time, GBP/USD was at 1.3309/10, up 0.10%.
- Risk Warning and Disclaimer
- The market involves risk, and trading may not be suitable for all investors. This article is for reference only and does not constitute personal investment advice, nor does it take into account certain users’ specific investment objectives, financial situation, or other needs. Any investment decisions made based on this information are at your own risk.