Crude oil analysis: Bullish momentum is building, Russia-Ukraine talks are stalled
2025-08-29 19:17:40
After several days of gains, oil prices have hit the lower end of last month's trading range of $65 to $70.5 - the market is now closely watching for more information related to the Russia-Ukraine conflict.
Despite numerous geopolitical talks between leaders of the United States, Ukraine, Russia, and the European Union over the past few weeks, the negotiations have remained deadlocked. The lack of progress, coupled with repeated Russian attacks on Kyiv, has exacerbated the situation.
German Chancellor Merz announced that Zelensky and Putin would not hold talks, which was not surprising considering that there had been no previous news indicating that the two sides intended to meet.
Prior to this, US official Kellogg was still trying to whitewash the current situation and describe the situation as more optimistic than it actually was.
Multiple pressures are also suppressing oil prices: on the one hand, the US Labor Day (Monday) is approaching, and the summer driving demand peak season is coming to an end; on the other hand, the voluntary production cuts of major oil-producing countries are about to expire, and market supply will further increase.
Below is a technical analysis of West Texas Intermediate (WTI) crude oil trading.
Technical Analysis
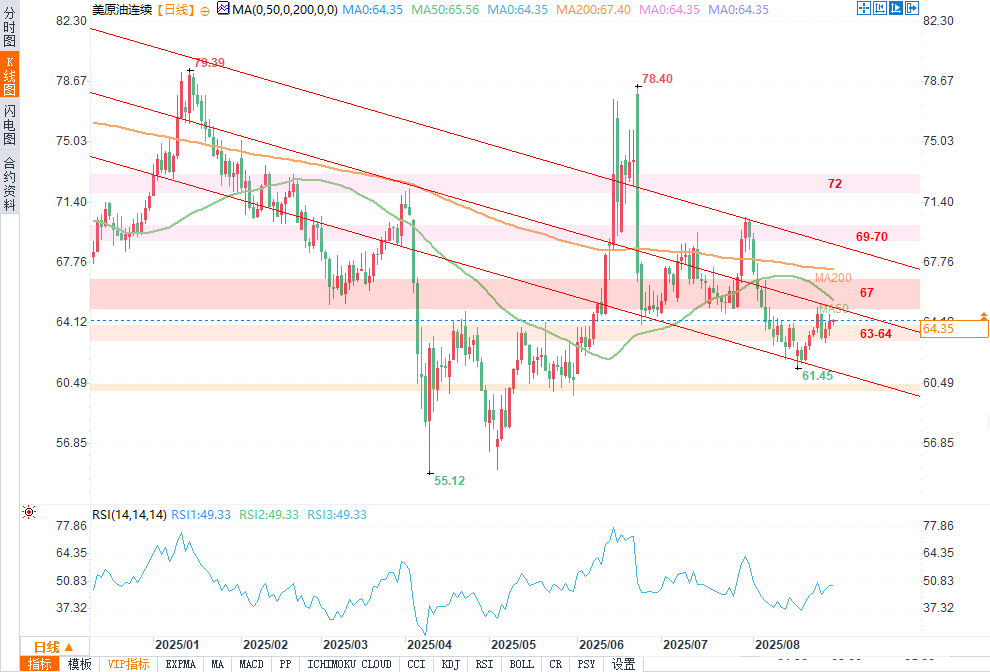
US crude oil daily chart

(WTI crude oil daily chart source: Yihuitong)
The previous low of WTI crude oil has led to the formation of a medium-term downward channel; and since the last technical rebound, oil prices have continued to rise.
The previous accumulation of buying had pushed oil prices to break through the channel constraints; now, the stalemate in the fundamental situation has further fueled the current rise.
US President Trump has once again emphasized sanctions on India, and it seems that forcing Russia to cease fire through economic pressure has become one of the only viable ways to reach some kind of truce agreement.
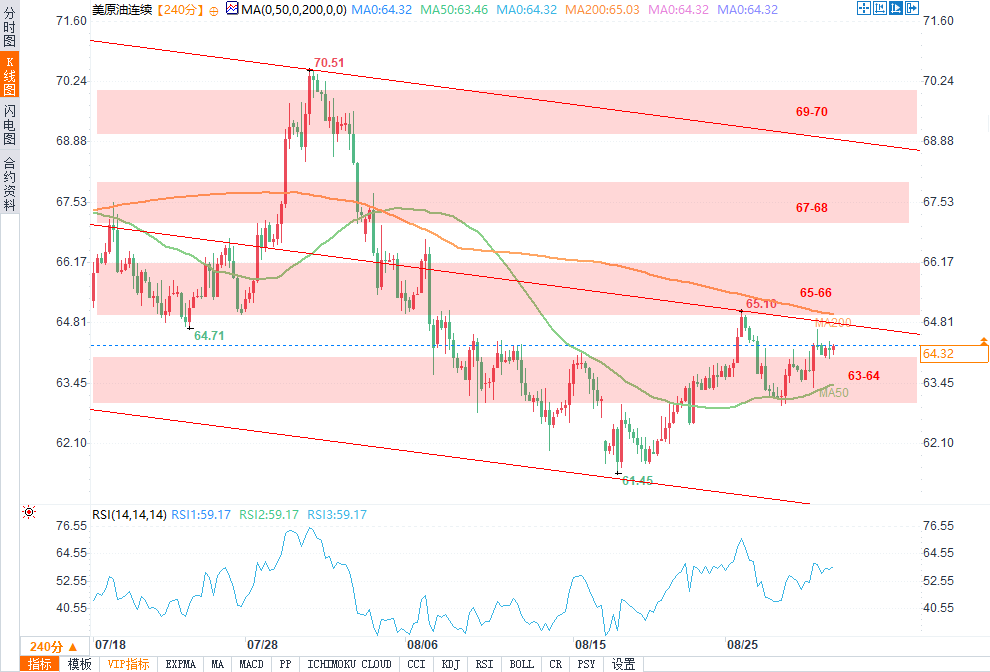
US crude oil 4-hour chart

(WTI crude oil 4-hour chart source: Yihuitong)
Bullish momentum is building in the current uptrend candlestick pattern – the latest news seems to continue attracting buyers.
It is important to watch whether oil prices can break above the 200-period 4HMA on the 4-hour chart: once this level is broken, it is expected to attract more buying, further pushing up oil prices.
Here are the key levels to watch on the WTI crude oil chart:
resistance level
$65 key pivot area (currently being tested)
Monday’s high coincides with the 200-period moving average on the 4-hour chart: $65.70
Mid-range price of $66 to $67
High resistance range: $67.30 to $68 (resonating with the 50-period and 200-period moving averages on the daily chart)
Support level
$62.00 to $62.50 consolidation support range
Wednesday’s Low: $62.19 (currently forming a double bottom pattern)
May range low: $60.5
2025 Low Range: $55 to $57 (Major Support)
In the past few weeks, the market seems to have accumulated a considerable amount of short positions; if oil prices continue to rise, it may trigger "short covering". Please continue to pay attention to the 200-period moving average on the 4-hour chart mentioned above.
- Risk Warning and Disclaimer
- The market involves risk, and trading may not be suitable for all investors. This article is for reference only and does not constitute personal investment advice, nor does it take into account certain users’ specific investment objectives, financial situation, or other needs. Any investment decisions made based on this information are at your own risk.


