Technical analysis: AUD/USD may rise further to key resistance level, with positive Chinese inflation data supporting the Australian dollar
2025-09-10 18:22:39
The Australian dollar was the strongest performing major currency against the U.S. dollar during the European trading session on Wednesday (September 10). The current upward momentum of the AUD/USD was also due to China's latest key inflation data for August, which boosted market confidence in the Chinese economy.
China's core CPI further rebounded to positive growth range
China is a key trading partner of Australia. If China's consumption demand for Australian mineral raw materials increases, it is likely to put upward pressure on the Australian dollar.
China's overall consumer price index (CPI) in August performed worse than expected, falling from flat in July to -0.4% year-on-year, but the core CPI, which excludes food and energy prices, rebounded further from 0.8% year-on-year in July to 0.9% in August, continuing to maintain positive growth.
Overall, China's core CPI has been on an upward trend for the past six months, since it recorded a year-on-year decrease of -0.1% in February 2025. It is worth noting that the long-term trend of the Australian dollar against the US dollar is directly correlated with the trend of China's core CPI.
The positive trend in China's core CPI is expected to boost consumer confidence. If market confidence recovers, it may drive an increase in China's demand for Australian mineral raw materials, thus forming a positive feedback loop and providing support for further strengthening of the Australian dollar.
Technical Analysis
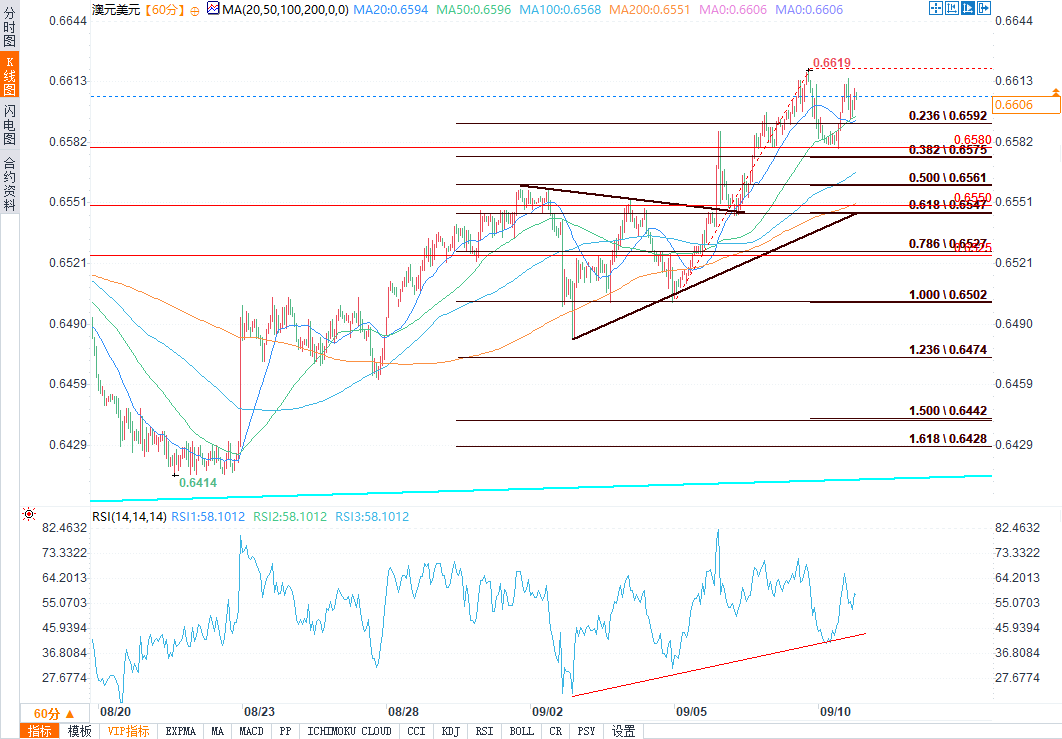
(AUD/USD 1-hour chart source: Yihuitong)
AUD/USD continued to find support above the 0.6500 mark and started a new round of growth. AUD/USD broke through the 0.6550 and 0.6580 marks and entered the upward range.
From the 1-hour chart, the currency pair has stabilized above the 20-period simple moving average and the 50-period simple moving average. Previously, the price even rose to around 0.6615 before encountering some resistance.
The Relative Strength Index (RSI) has successfully rebounded from parallel rising support, suggesting that short-term bullish momentum remains intact. Since April 22, 2025, AUD/USD has been trading within a medium-term "expanding wedge" pattern, with the upper boundary/resistance level located between 0.6660 and 0.6700.
Upside
On the upside, the pair could face resistance around 0.6620. The first major resistance level facing bulls is 0.6640, a break above which could pave the way for further gains. In this scenario, AUD/USD could rise to 0.6720, above which bulls could launch a push towards 0.6850.
If the upward trend continues, the price may even push towards 0.6900.
Downside
On the downside, the immediate support level is 0.6575, and the next key focus may be 0.6550. Meanwhile, a key bullish trend line is forming on the 1-hour chart, with support at 0.6540.
The trend line is close to the 61.8% Fibonacci retracement level of the upward move from the 0.6501 low (short-term swing low) to the 0.6619 high (short-term swing high). If the decline continues, the price may fall to around 0.6510.
Upcoming key economic data
U.S. Producer Price Index (PPI, monthly) for August 2025 – +0.3% expected, +0.9% prior.
U.S. Producer Price Index (PPI, annual) for August 2025 – +3.3% expected, previous value +3.3%.
U.S. Wholesale Inventories July 2025 (preliminary data) – +0.2% expected, previous value +0.2%.
China's core CPI further rebounded to positive growth range
China is a key trading partner of Australia. If China's consumption demand for Australian mineral raw materials increases, it is likely to put upward pressure on the Australian dollar.
China's overall consumer price index (CPI) in August performed worse than expected, falling from flat in July to -0.4% year-on-year, but the core CPI, which excludes food and energy prices, rebounded further from 0.8% year-on-year in July to 0.9% in August, continuing to maintain positive growth.
Overall, China's core CPI has been on an upward trend for the past six months, since it recorded a year-on-year decrease of -0.1% in February 2025. It is worth noting that the long-term trend of the Australian dollar against the US dollar is directly correlated with the trend of China's core CPI.
The positive trend in China's core CPI is expected to boost consumer confidence. If market confidence recovers, it may drive an increase in China's demand for Australian mineral raw materials, thus forming a positive feedback loop and providing support for further strengthening of the Australian dollar.
Technical Analysis
(AUD/USD 1-hour chart source: Yihuitong)
AUD/USD continued to find support above the 0.6500 mark and started a new round of growth. AUD/USD broke through the 0.6550 and 0.6580 marks and entered the upward range.
From the 1-hour chart, the currency pair has stabilized above the 20-period simple moving average and the 50-period simple moving average. Previously, the price even rose to around 0.6615 before encountering some resistance.
The Relative Strength Index (RSI) has successfully rebounded from parallel rising support, suggesting that short-term bullish momentum remains intact. Since April 22, 2025, AUD/USD has been trading within a medium-term "expanding wedge" pattern, with the upper boundary/resistance level located between 0.6660 and 0.6700.
Upside
On the upside, the pair could face resistance around 0.6620. The first major resistance level facing bulls is 0.6640, a break above which could pave the way for further gains. In this scenario, AUD/USD could rise to 0.6720, above which bulls could launch a push towards 0.6850.
If the upward trend continues, the price may even push towards 0.6900.
Downside
On the downside, the immediate support level is 0.6575, and the next key focus may be 0.6550. Meanwhile, a key bullish trend line is forming on the 1-hour chart, with support at 0.6540.
The trend line is close to the 61.8% Fibonacci retracement level of the upward move from the 0.6501 low (short-term swing low) to the 0.6619 high (short-term swing high). If the decline continues, the price may fall to around 0.6510.
Upcoming key economic data
U.S. Producer Price Index (PPI, monthly) for August 2025 – +0.3% expected, +0.9% prior.
U.S. Producer Price Index (PPI, annual) for August 2025 – +3.3% expected, previous value +3.3%.
U.S. Wholesale Inventories July 2025 (preliminary data) – +0.2% expected, previous value +0.2%.
- Risk Warning and Disclaimer
- The market involves risk, and trading may not be suitable for all investors. This article is for reference only and does not constitute personal investment advice, nor does it take into account certain users’ specific investment objectives, financial situation, or other needs. Any investment decisions made based on this information are at your own risk.