


Spot gold fell above the 4000 mark and rebounded to around 4070
2025-10-23 01:57:04
On Wednesday (October 22), gold prices continued to be under pressure, approaching the $4,000 mark for a time, before rebounding to around $4,050. The US dollar maintained a modest but positive upward trend in the first half of Wednesday, but gradually lost momentum after the opening of Wall Street stocks.

The market was relatively optimistic earlier as investors expected the two leaders to discuss a trade agreement and avoid escalating tensions. However, the situation took a turn when people familiar with the matter revealed that the White House was considering a plan to impose some restrictions on software exports.
In addition, the US government shutdown continues. The deadlock has entered its 22nd day, and House Speaker Johnson accused the Democrats of "dragging their feet" and making it difficult to advance necessary matters on time.
“It remains to be seen why precious metals fell yesterday and whether this is the start of a larger correction,” Ipek Ozkardeskaya, senior analyst at Swissquote, wrote in a note on Wednesday.
Ozkardskaya said Tuesday's decline was "triggered by a combination of expectations of a de-escalation in U.S.-China trade tensions and a rebound in the U.S. dollar."
However, she also noted that the future trend is far from certain, and many of the factors that attracted investors to gold this year remain. She added: "Perhaps a better explanation for the sell-off in precious metals yesterday is that these metals are currently in a severely overbought market and volatility has increased," and pointed out that gold prices may have further corrections.
The U.S. Commodity Futures Trading Commission (CFTC) has previously warned people to be cautious about investing in gold. The commission noted that precious metals prices are highly volatile and tend to rise with demand, meaning that "when economic anxiety or instability increases, it is sellers who typically profit from precious metals trading."
Technical Analysis
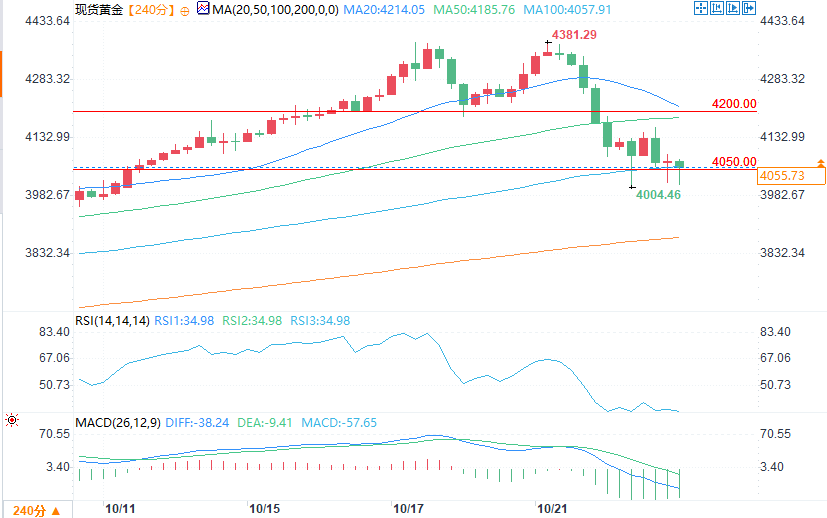
(Source of spot gold 4-hour chart: Yihuitong)
From a technical perspective, spot gold faces the risk of further decline, particularly if the $4,000 level falls. The daily chart shows the pair rebounding from support at the bullish 20-day simple moving average (SMA), but the 100- and 200-day SMAs remain below the shorter-term moving averages, maintaining their bullish slopes. Meanwhile, technical indicators continue their downward trend, heading south within positive territory.
In the short term, the 4-hour chart shows spot gold oscillating near the bullish 100-day simple moving average, while the 20-day simple moving average is exerting downward traction above the current price, creating resistance near $4,025. Finally, technical indicators are near oversold territory, with uneven momentum, and downside risks remain dominant.
Support levels: $4000.00, $3986.45, $3972.10
Resistance: $4061.20, $4085.70, $4110.00
The market was relatively optimistic earlier as investors expected the two leaders to discuss a trade agreement and avoid escalating tensions. However, the situation took a turn when people familiar with the matter revealed that the White House was considering a plan to impose some restrictions on software exports.
In addition, the US government shutdown continues. The deadlock has entered its 22nd day, and House Speaker Johnson accused the Democrats of "dragging their feet" and making it difficult to advance necessary matters on time.
“It remains to be seen why precious metals fell yesterday and whether this is the start of a larger correction,” Ipek Ozkardeskaya, senior analyst at Swissquote, wrote in a note on Wednesday.
Ozkardskaya said Tuesday's decline was "triggered by a combination of expectations of a de-escalation in U.S.-China trade tensions and a rebound in the U.S. dollar."
However, she also noted that the future trend is far from certain, and many of the factors that attracted investors to gold this year remain. She added: "Perhaps a better explanation for the sell-off in precious metals yesterday is that these metals are currently in a severely overbought market and volatility has increased," and pointed out that gold prices may have further corrections.
The U.S. Commodity Futures Trading Commission (CFTC) has previously warned people to be cautious about investing in gold. The commission noted that precious metals prices are highly volatile and tend to rise with demand, meaning that "when economic anxiety or instability increases, it is sellers who typically profit from precious metals trading."
Technical Analysis
(Source of spot gold 4-hour chart: Yihuitong)
From a technical perspective, spot gold faces the risk of further decline, particularly if the $4,000 level falls. The daily chart shows the pair rebounding from support at the bullish 20-day simple moving average (SMA), but the 100- and 200-day SMAs remain below the shorter-term moving averages, maintaining their bullish slopes. Meanwhile, technical indicators continue their downward trend, heading south within positive territory.
In the short term, the 4-hour chart shows spot gold oscillating near the bullish 100-day simple moving average, while the 20-day simple moving average is exerting downward traction above the current price, creating resistance near $4,025. Finally, technical indicators are near oversold territory, with uneven momentum, and downside risks remain dominant.
Support levels: $4000.00, $3986.45, $3972.10
Resistance: $4061.20, $4085.70, $4110.00
- Risk Warning and Disclaimer
- The market involves risk, and trading may not be suitable for all investors. This article is for reference only and does not constitute personal investment advice, nor does it take into account certain users’ specific investment objectives, financial situation, or other needs. Any investment decisions made based on this information are at your own risk.


