Strong US non-farm payroll data and lower oil prices combined to keep the USD/CAD pair in a volatile rebound.
2026-02-13 10:35:39
On Friday during Asian trading hours, the USD/CAD pair traded around 1.3615, maintaining a generally bullish bias. In the US, non-farm payrolls increased by 130,000 in January, far exceeding market expectations of 70,000, while the unemployment rate fell to 4.3%, demonstrating the resilience of the labor market.
This data lowered market expectations for a near-term interest rate cut by the Federal Reserve, supporting a stronger dollar. In Canada, falling oil prices put downward pressure on the Canadian dollar. As a major oil exporter, the Canadian dollar is typically positively correlated with oil prices, and the decline in oil prices weakened the Loonie's support for the dollar.
Although some Federal Reserve officials have made dovish comments, suggesting that monetary policy is already tight and lower interest rates are tolerable, this may limit the short-term rebound of the dollar. However, strong employment data and interest rate differentials remain the core factors supporting the dollar.
The market remains closely watching US CPI data, which will provide clues about the Federal Reserve's interest rate path and could trigger short-term volatility in USD/CAD. Investors should pay attention to the continuity of employment data, oil price dynamics, and the impact of the Fed's statement on the US dollar and Canadian dollar.
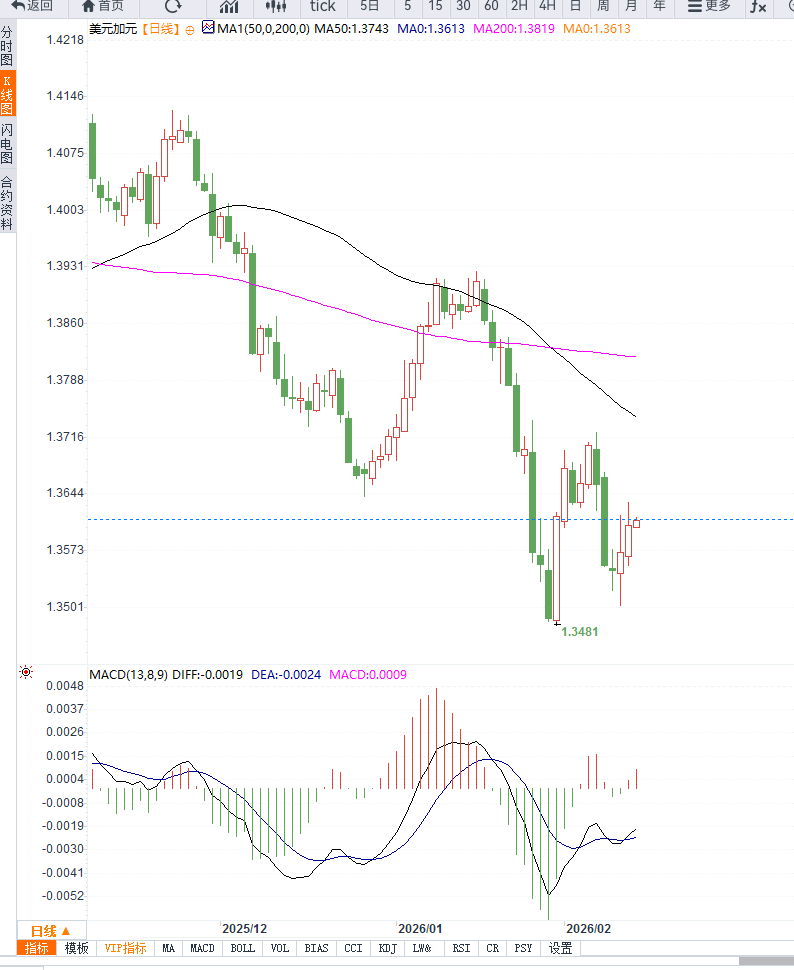
From the daily chart, USD/CAD has maintained a slightly bullish trend after rebounding from recent lows. The price holding above 1.3600 indicates effective short-term support. The moving average system is in a bullish alignment, with short-term moving averages above long-term moving averages, suggesting continued upward momentum.
The daily support level is around 1.3600. If the price retraces to this area and stabilizes, it can be considered a short-term buying opportunity. Further support levels are at 1.3570 and 1.3540, which form a defensive line against a bearish breakout.
The first resistance level is at 1.3650, followed by 1.3680 and the 1.3700 area. If the price can effectively break through 1.3650, it may test the 1.3680-1.3700 range, opening up short-term upward momentum. The RSI is above 50, indicating a bullish trend, and the MACD histogram is expanding moderately, suggesting that there is still room for upward movement in the short term, but the sustainability of this momentum needs to be monitored.
The 4-hour chart shows that USD/CAD is consolidating in the 1.3600-1.3650 range, forming a box pattern. The current price is near the midpoint of this range, indicating a temporary balance between bullish and bearish forces.
The support level is at 1.3600; if this level is breached, the price may retrace to 1.3570 or even 1.3540. The resistance level is at 1.3650; a break above this level would test 1.3680-1.3700. The RSI is oscillating around 50, and the MACD is flattening. The short-term trend is heavily influenced by the upcoming CPI data, and the direction is highly dependent on the data.
Overall, the technical structure on the daily chart is slightly bullish, but we still need to be wary of the risk of a period of adjustment due to fluctuations in CPI and oil prices.
Editor's Note:
The USD/CAD pair is currently supported by both strong US non-farm payrolls and downward pressure on the Canadian dollar from oil prices, indicating a clear short-term bullish structure. Close attention should be paid to US CPI data and oil price fluctuations, as these will determine the short-term direction. Overall, the medium-to-short-term trend is predominantly bullish with some volatility, but caution is still warranted regarding potential periodic corrections triggered by policy and commodity price fluctuations.
This data lowered market expectations for a near-term interest rate cut by the Federal Reserve, supporting a stronger dollar. In Canada, falling oil prices put downward pressure on the Canadian dollar. As a major oil exporter, the Canadian dollar is typically positively correlated with oil prices, and the decline in oil prices weakened the Loonie's support for the dollar.
Although some Federal Reserve officials have made dovish comments, suggesting that monetary policy is already tight and lower interest rates are tolerable, this may limit the short-term rebound of the dollar. However, strong employment data and interest rate differentials remain the core factors supporting the dollar.
The market remains closely watching US CPI data, which will provide clues about the Federal Reserve's interest rate path and could trigger short-term volatility in USD/CAD. Investors should pay attention to the continuity of employment data, oil price dynamics, and the impact of the Fed's statement on the US dollar and Canadian dollar.
From the daily chart, USD/CAD has maintained a slightly bullish trend after rebounding from recent lows. The price holding above 1.3600 indicates effective short-term support. The moving average system is in a bullish alignment, with short-term moving averages above long-term moving averages, suggesting continued upward momentum.
The daily support level is around 1.3600. If the price retraces to this area and stabilizes, it can be considered a short-term buying opportunity. Further support levels are at 1.3570 and 1.3540, which form a defensive line against a bearish breakout.
The first resistance level is at 1.3650, followed by 1.3680 and the 1.3700 area. If the price can effectively break through 1.3650, it may test the 1.3680-1.3700 range, opening up short-term upward momentum. The RSI is above 50, indicating a bullish trend, and the MACD histogram is expanding moderately, suggesting that there is still room for upward movement in the short term, but the sustainability of this momentum needs to be monitored.
The 4-hour chart shows that USD/CAD is consolidating in the 1.3600-1.3650 range, forming a box pattern. The current price is near the midpoint of this range, indicating a temporary balance between bullish and bearish forces.
The support level is at 1.3600; if this level is breached, the price may retrace to 1.3570 or even 1.3540. The resistance level is at 1.3650; a break above this level would test 1.3680-1.3700. The RSI is oscillating around 50, and the MACD is flattening. The short-term trend is heavily influenced by the upcoming CPI data, and the direction is highly dependent on the data.
Overall, the technical structure on the daily chart is slightly bullish, but we still need to be wary of the risk of a period of adjustment due to fluctuations in CPI and oil prices.
Editor's Note:
The USD/CAD pair is currently supported by both strong US non-farm payrolls and downward pressure on the Canadian dollar from oil prices, indicating a clear short-term bullish structure. Close attention should be paid to US CPI data and oil price fluctuations, as these will determine the short-term direction. Overall, the medium-to-short-term trend is predominantly bullish with some volatility, but caution is still warranted regarding potential periodic corrections triggered by policy and commodity price fluctuations.
- Risk Warning and Disclaimer
- The market involves risk, and trading may not be suitable for all investors. This article is for reference only and does not constitute personal investment advice, nor does it take into account certain users’ specific investment objectives, financial situation, or other needs. Any investment decisions made based on this information are at your own risk.