With the 50% tariff countdown underway, the real risks facing the Canadian dollar may be misinterpreted by the market.
2026-08-17 17:56:56
On Monday, August 17th, the USD/CAD pair was trading around 1.386. Market attention is shifting from the previous repricing of US interest rates to Canada's July Consumer Price Index (CPI) and the new round of trade measures set to take effect on August 19th. Canada's June CPI was 2.8% year-on-year, and July data will be released tonight. The market generally expects the overall CPI to rise slightly to 2.9%, but key core indicators are likely to remain around 2% or even below. The most significant trading information regarding this CPI is not whether the overall year-on-year increase will rise from 2.8% to 2.9%, but rather the potential for a continued significant divergence between overall inflation and core inflation. Canada's overall CPI fell to 2.8% year-on-year in June from 3.2% in May, with a sharp monthly decline in gasoline prices being the main drag; excluding gasoline, the year-on-year inflation was approximately 2.2%. More noteworthy for the interest rate market is that the Bank of Canada's key CPI targets, the median and cut-off mean CPI, fell to approximately 1.9% and 1.8% respectively, averaging around 1.85%.  A significant source of renewed inflation in July is likely to remain energy. Institutions predict that gasoline prices in July were approximately 25% higher than the same period last year, up from about 20% year-on-year in June, but the spread of energy costs to other consumer items remains limited. Market forecasts for core CPI, excluding food and energy, are concentrated between 1.8% and 1.9%, with the median and cut-off mean expected to remain around 2%. This means that if the overall CPI increase is primarily driven by the energy base and gasoline prices, then a nominal reading of 2.9% cannot be simply equated with persistent inflationary pressure. For the yield curve, the key factors determining the repricing magnitude remain service prices, core indicators, and the breadth of price increases, rather than a single overall CPI figure. On July 15, the Bank of Canada maintained its overnight rate target at 2.25%, the bank rate at 2.50%, and the deposit rate at 2.20%, marking the sixth consecutive time it has kept policy rates unchanged. More importantly, the policy wording has changed. The Bank of Canada's latest monetary policy report suggests that the economy has shown signs of improvement after a period of weakness, with future growth potentially rebounding and inflation expected to gradually decline to around 2%. The report also explicitly points out that inflation excluding gasoline remains close to 2%, indicating that there is still spare capacity in the economy. Therefore, the Canadian dollar currently faces a rather delicate interest rate structure. The question is no longer whether the Bank of Canada will immediately change its policy, but whether the market's previously priced-in future tightening will match core inflation. After the July policy meeting, the swap market initially only priced in about 15 basis points of tightening by the end of the year, while some recent market views still suggest a significant premium for rate hikes over the next 12 months. If core inflation remains around 2% for an extended period, the tightening premium in the forward curve will require more concrete data to justify its rationale. The market believes that if core inflation continues to fall below 2%, and trade frictions increase economic headwinds, the logic for a prolonged pause in interest rate hikes by the Bank of Canada will be strengthened. Another variable entering the pricing window is trade policy. The announced measures indicate that a 50% tariff will be imposed on some Canadian goods, including alcoholic beverages, hockey equipment, and cement, with the measures scheduled to take effect on August 19. Exemptions will be granted for energy, potash fertilizer, some goods already subject to other tariff arrangements, as well as fish and critical minerals. It is worth noting that the impact of these measures on the Canadian macroeconomy is closer to a structural demand shock than a simple imported inflation. Recent calculations show that the targeted goods account for approximately 5% of Canada's exports to the US, and the economic activity involved is equivalent to about 0.4% of Canada's GDP and employment. Meanwhile, approximately 80% of Canada's exports to the US will continue to enjoy duty-free treatment under the existing trade framework, thus limiting the overall macroeconomic impact. However, the production and employment risks in specific manufacturing sectors such as clothing, electrical equipment, and home appliances will be more concentrated. This is precisely the policy dilemma facing the Bank of Canada. If tariffs weaken external demand and business investment, while core inflation remains close to 2%, there is no sufficient reason for monetary policy to strengthen its tightening stance solely due to a temporary increase in overall CPI driven by energy. In other words, the key transmission chain of trade frictions affecting the Canadian dollar is likely to pass first through growth expectations and the interest rate curve, rather than directly through consumer prices. Looking at the daily chart, the USD/CAD pair previously formed a high around 1.4247, and since then, both highs and lows have generally shifted downwards, with the current exchange rate around 1.3855. The Bollinger Band middle band is at 1.4022, the upper band at 1.4177, and the lower band at 1.3866. The current price is slightly below the lower band, and the Bollinger Band middle band has clearly sloped downwards.
 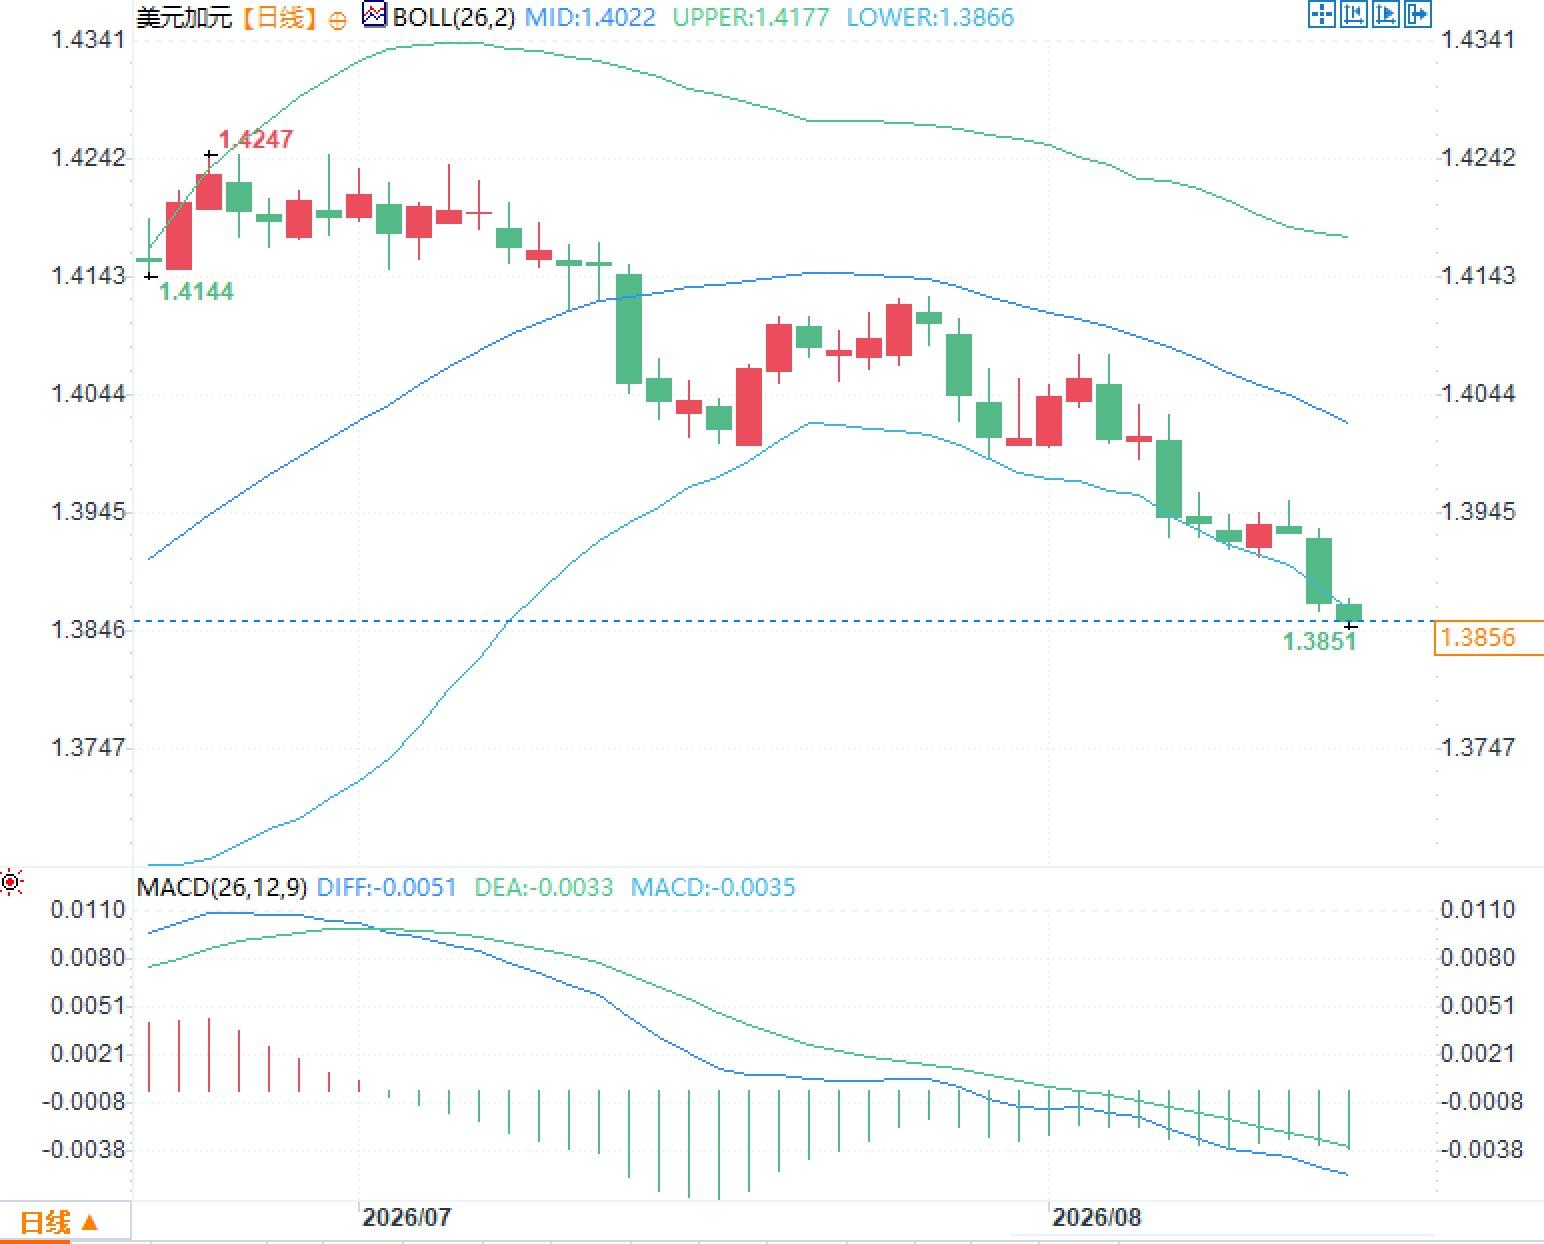 The MACD also shows that trend momentum remains in negative territory. The DIFF is -0.0051 and the DEA is -0.0033, both lines are below the zero line, with the DIFF below the DEA. Combined with the daily candlestick chart consistently trading below the Bollinger Middle Band, this confirms that the market is currently in a clear trend-following phase.
A significant source of renewed inflation in July is likely to remain energy. Institutions predict that gasoline prices in July were approximately 25% higher than the same period last year, up from about 20% year-on-year in June, but the spread of energy costs to other consumer items remains limited. Market forecasts for core CPI, excluding food and energy, are concentrated between 1.8% and 1.9%, with the median and cut-off mean expected to remain around 2%. This means that if the overall CPI increase is primarily driven by the energy base and gasoline prices, then a nominal reading of 2.9% cannot be simply equated with persistent inflationary pressure. For the yield curve, the key factors determining the repricing magnitude remain service prices, core indicators, and the breadth of price increases, rather than a single overall CPI figure. On July 15, the Bank of Canada maintained its overnight rate target at 2.25%, the bank rate at 2.50%, and the deposit rate at 2.20%, marking the sixth consecutive time it has kept policy rates unchanged. More importantly, the policy wording has changed. The Bank of Canada's latest monetary policy report suggests that the economy has shown signs of improvement after a period of weakness, with future growth potentially rebounding and inflation expected to gradually decline to around 2%. The report also explicitly points out that inflation excluding gasoline remains close to 2%, indicating that there is still spare capacity in the economy. Therefore, the Canadian dollar currently faces a rather delicate interest rate structure. The question is no longer whether the Bank of Canada will immediately change its policy, but whether the market's previously priced-in future tightening will match core inflation. After the July policy meeting, the swap market initially only priced in about 15 basis points of tightening by the end of the year, while some recent market views still suggest a significant premium for rate hikes over the next 12 months. If core inflation remains around 2% for an extended period, the tightening premium in the forward curve will require more concrete data to justify its rationale. The market believes that if core inflation continues to fall below 2%, and trade frictions increase economic headwinds, the logic for a prolonged pause in interest rate hikes by the Bank of Canada will be strengthened. Another variable entering the pricing window is trade policy. The announced measures indicate that a 50% tariff will be imposed on some Canadian goods, including alcoholic beverages, hockey equipment, and cement, with the measures scheduled to take effect on August 19. Exemptions will be granted for energy, potash fertilizer, some goods already subject to other tariff arrangements, as well as fish and critical minerals. It is worth noting that the impact of these measures on the Canadian macroeconomy is closer to a structural demand shock than a simple imported inflation. Recent calculations show that the targeted goods account for approximately 5% of Canada's exports to the US, and the economic activity involved is equivalent to about 0.4% of Canada's GDP and employment. Meanwhile, approximately 80% of Canada's exports to the US will continue to enjoy duty-free treatment under the existing trade framework, thus limiting the overall macroeconomic impact. However, the production and employment risks in specific manufacturing sectors such as clothing, electrical equipment, and home appliances will be more concentrated. This is precisely the policy dilemma facing the Bank of Canada. If tariffs weaken external demand and business investment, while core inflation remains close to 2%, there is no sufficient reason for monetary policy to strengthen its tightening stance solely due to a temporary increase in overall CPI driven by energy. In other words, the key transmission chain of trade frictions affecting the Canadian dollar is likely to pass first through growth expectations and the interest rate curve, rather than directly through consumer prices. Looking at the daily chart, the USD/CAD pair previously formed a high around 1.4247, and since then, both highs and lows have generally shifted downwards, with the current exchange rate around 1.3855. The Bollinger Band middle band is at 1.4022, the upper band at 1.4177, and the lower band at 1.3866. The current price is slightly below the lower band, and the Bollinger Band middle band has clearly sloped downwards. The MACD also shows that trend momentum remains in negative territory. The DIFF is -0.0051 and the DEA is -0.0033, both lines are below the zero line, with the DIFF below the DEA. Combined with the daily candlestick chart consistently trading below the Bollinger Middle Band, this confirms that the market is currently in a clear trend-following phase.
- Risk Warning and Disclaimer
- The market involves risk, and trading may not be suitable for all investors. This article is for reference only and does not constitute personal investment advice, nor does it take into account certain users’ specific investment objectives, financial situation, or other needs. Any investment decisions made based on this information are at your own risk.