WTI crude oil at the $85 mark: A term structure trap hidden beneath the surface.
2026-08-24 19:54:59
On Monday (August 24), during the European trading session, West Texas Intermediate (WTI) crude oil was trading at $85.47 per barrel, down 1.83% on the day; Brent crude oil was trading at $93.18 per barrel, down 0.72%. The market's initial reaction would be to interpret this decline as a drop in risk appetite, especially given that gold has surged to $4643.02 per ounce, and the entire precious metals sector is generally strong. However, this interpretation is superficial. The core of the WTI crude oil market lies not in dollar fluctuations or stock market movements, but in the quietly weakening forward curve—a point that most traders who only look at price quotes have overlooked.  The current market is not experiencing a technical precipitous drop, but rather falling into a term structure trap. Near-month contracts have held psychological support levels, but far-month contracts have already released drastically different signals regarding the physical supply and demand landscape. The spread between the 6-12 month contracts we are closely monitoring has narrowed significantly in the past two trading days, yet near-month contract prices have remained resilient. This is the key clue. Supply Side: OPEC+'s Production Cut Implementation Shows Initial Cracks The mainstream narrative surrounding OPEC+ is "voluntary production cuts to maintain market stability." However, the price spread trend reveals the reality: the implementation of production cuts by various oil-producing countries has loosened marginally. Some oil-producing countries are quietly increasing crude oil exports, dumping more oil into the Atlantic basin, hoping to maximize revenue before production quotas may be lifted in the fourth quarter. Internal OPEC+ data we track through secondary channels shows that the actual production of leading oil-producing countries is slightly and consistently exceeding the agreed-upon production ceiling. The situation in the United States is equally concerning. While domestic crude oil production in the US remains stable, the number of drilling rigs has declined for three consecutive weeks. On the surface, this seems like a positive signal: fewer drilling rigs mean future supply contraction. However, the market hasn't yet responded positively. Natural gas from associated oil wells is keeping natural gas prices at $2.77 per million British thermal units (MMBtu), while associated crude oil continues to flow to Cushing, the crude oil delivery center. The current bottleneck isn't crude oil production, but rather logistics and refinery operating rates. Until there's a substantial reduction in inventories, the logic of "proactive supply control" remains theoretical. Demand Signals: Refining Crack Spread as a Leading Warning Indicator Technical signals on the demand side deserve close attention. Over the past week, refining crack spreads (the profit margin from processing crude oil into gasoline and distillate fuels) have narrowed significantly. This isn't a seasonal phenomenon, but rather a result of continuously squeezed profits. Retail gasoline demand is weak; besides regular industrial purchases, distillate fuels are also struggling to find buyers. The USD/CAD exchange rate is 1.3793, which also indicates that energy exports have failed to provide any support for the Canadian dollar. The overall macroeconomic environment is also putting downward pressure on crude oil prices. The euro traded at 1.1685 against the dollar, and the pound at 1.3654, indicating that the dollar has not weakened significantly. Historically, dollar-denominated crude oil has tended to be under pressure when the dollar is strong. The dollar traded at 158.87 against the yen, suggesting that carry trades are still ongoing, but this has not driven increased demand for crude oil. Asian physical buyers are waiting for more suitable entry prices, and the market is creating opportunities for them. Technical Analysis: The Really Key Price Range
 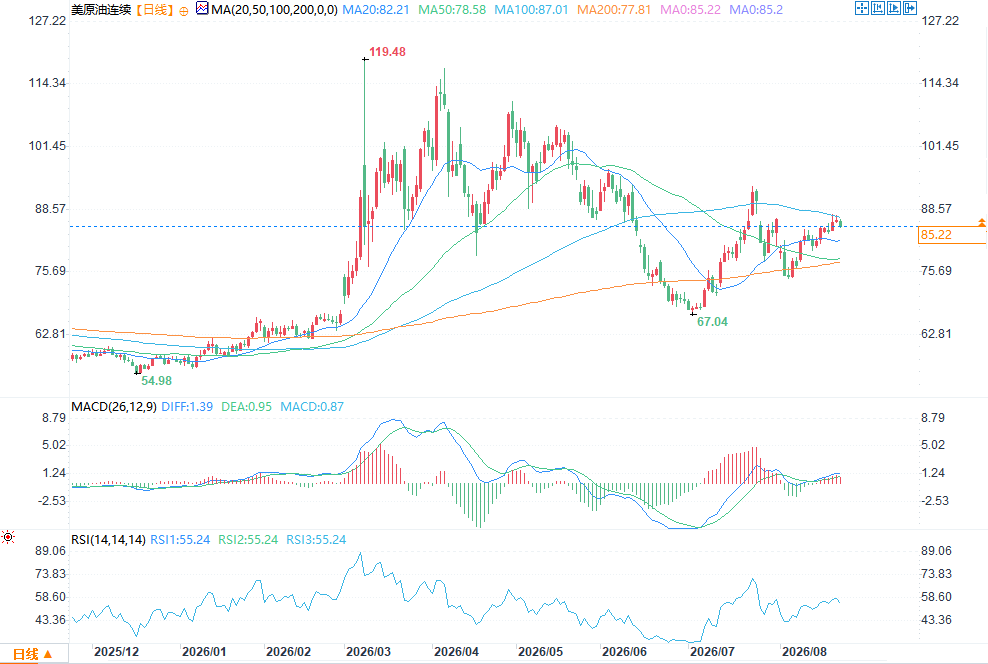 (WTI Crude Oil Daily Chart Source: EasyForex) Ignoring the noise, let's look at the technical charts. Over the past ten trading days, WTI crude oil has formed a clear short-term trading range: $84.20-$87.10 per barrel. Currently, at $85.56, it's right in the middle of this range, indicating a highly uncertain market direction. The 20-day and 50-day moving averages are gradually converging; historically, this pattern has often been followed by increased volatility, suggesting the market is building momentum for a breakout. Immediate support: $84.20 per barrel, the recent low, is the first line of defense. If the daily closing price breaks below this level, the next target is $82.80 per barrel, which is the 200-day moving average and a significant structural turning point. Resistance: $87.10 per barrel is the short-term top; the further upside target is $88.50 per barrel, but to break above this level, a substantial improvement in the physical supply and demand dynamics is needed, not just short-term news-driven stimuli. In terms of momentum indicators, the daily Relative Strength Index (RSI) is close to 48, in the neutral range; the MACD indicator is below the signal line, but the histogram is flattening. This is not a standard sell signal, but only indicates that the market is waiting for a catalyst. Market Scenario Analysis Bearish Scenario (45% probability): A break below $84.20/barrel with significant volume will trigger algorithmic selling, targeting $82.80/barrel. Weakening crack spreads and a lack of positive news regarding inventory levels support this scenario. Bullish Scenario (30% probability): Short covering at the close pushes oil prices back above $86.40, above the 20-day moving average. This scenario requires a catalyst: geopolitical conflict, a major pipeline disruption, or a larger-than-expected inventory drop. Without positive news, the probability of this scenario is low. Range-Bound Scenario (25% probability): Fluctuations between $85.00 and $86.50 without a decisive breakout. This means the market is awaiting the weekly inventory report, which is the most common outcome when bullish and bearish forces are balanced. Cross-market correlation: Crude oil traders need to pay attention to signals from gold . Signals from the precious metals market deserve close attention from crude oil traders. Gold at $4643.02/oz and silver at $68.67/oz are rising not solely due to inflation expectations, but also because of declining real yields and the influx of safe-haven funds. When gold rises by more than 1% in a single day while crude oil falls by nearly 2%, the market is pricing in concerns about economic growth, not rising inflation. This is crucial. If the market were driven by inflation, gold and crude oil should rise in tandem, but currently their trends have diverged. Looking ahead, $85.56 is merely the midpoint of the trading range, not a directional decision point. $84.20-$87.10 is the main battleground for bulls and bears, and the term structure is the most important observation window; a flattening forward curve is itself a risk warning. The divergence between rising gold and falling crude oil represents concerns about growth, not inflation trading. Overall, a bearish scenario is more likely in the next 48 hours. Don't blindly chase the breakout; patiently wait for the price to close outside the range on the daily chart before making a judgment. The true downside target is $82.80. It's better to wait for confirmation signals than to blindly try to catch a falling knife.
The current market is not experiencing a technical precipitous drop, but rather falling into a term structure trap. Near-month contracts have held psychological support levels, but far-month contracts have already released drastically different signals regarding the physical supply and demand landscape. The spread between the 6-12 month contracts we are closely monitoring has narrowed significantly in the past two trading days, yet near-month contract prices have remained resilient. This is the key clue. Supply Side: OPEC+'s Production Cut Implementation Shows Initial Cracks The mainstream narrative surrounding OPEC+ is "voluntary production cuts to maintain market stability." However, the price spread trend reveals the reality: the implementation of production cuts by various oil-producing countries has loosened marginally. Some oil-producing countries are quietly increasing crude oil exports, dumping more oil into the Atlantic basin, hoping to maximize revenue before production quotas may be lifted in the fourth quarter. Internal OPEC+ data we track through secondary channels shows that the actual production of leading oil-producing countries is slightly and consistently exceeding the agreed-upon production ceiling. The situation in the United States is equally concerning. While domestic crude oil production in the US remains stable, the number of drilling rigs has declined for three consecutive weeks. On the surface, this seems like a positive signal: fewer drilling rigs mean future supply contraction. However, the market hasn't yet responded positively. Natural gas from associated oil wells is keeping natural gas prices at $2.77 per million British thermal units (MMBtu), while associated crude oil continues to flow to Cushing, the crude oil delivery center. The current bottleneck isn't crude oil production, but rather logistics and refinery operating rates. Until there's a substantial reduction in inventories, the logic of "proactive supply control" remains theoretical. Demand Signals: Refining Crack Spread as a Leading Warning Indicator Technical signals on the demand side deserve close attention. Over the past week, refining crack spreads (the profit margin from processing crude oil into gasoline and distillate fuels) have narrowed significantly. This isn't a seasonal phenomenon, but rather a result of continuously squeezed profits. Retail gasoline demand is weak; besides regular industrial purchases, distillate fuels are also struggling to find buyers. The USD/CAD exchange rate is 1.3793, which also indicates that energy exports have failed to provide any support for the Canadian dollar. The overall macroeconomic environment is also putting downward pressure on crude oil prices. The euro traded at 1.1685 against the dollar, and the pound at 1.3654, indicating that the dollar has not weakened significantly. Historically, dollar-denominated crude oil has tended to be under pressure when the dollar is strong. The dollar traded at 158.87 against the yen, suggesting that carry trades are still ongoing, but this has not driven increased demand for crude oil. Asian physical buyers are waiting for more suitable entry prices, and the market is creating opportunities for them. Technical Analysis: The Really Key Price Range (WTI Crude Oil Daily Chart Source: EasyForex) Ignoring the noise, let's look at the technical charts. Over the past ten trading days, WTI crude oil has formed a clear short-term trading range: $84.20-$87.10 per barrel. Currently, at $85.56, it's right in the middle of this range, indicating a highly uncertain market direction. The 20-day and 50-day moving averages are gradually converging; historically, this pattern has often been followed by increased volatility, suggesting the market is building momentum for a breakout. Immediate support: $84.20 per barrel, the recent low, is the first line of defense. If the daily closing price breaks below this level, the next target is $82.80 per barrel, which is the 200-day moving average and a significant structural turning point. Resistance: $87.10 per barrel is the short-term top; the further upside target is $88.50 per barrel, but to break above this level, a substantial improvement in the physical supply and demand dynamics is needed, not just short-term news-driven stimuli. In terms of momentum indicators, the daily Relative Strength Index (RSI) is close to 48, in the neutral range; the MACD indicator is below the signal line, but the histogram is flattening. This is not a standard sell signal, but only indicates that the market is waiting for a catalyst. Market Scenario Analysis Bearish Scenario (45% probability): A break below $84.20/barrel with significant volume will trigger algorithmic selling, targeting $82.80/barrel. Weakening crack spreads and a lack of positive news regarding inventory levels support this scenario. Bullish Scenario (30% probability): Short covering at the close pushes oil prices back above $86.40, above the 20-day moving average. This scenario requires a catalyst: geopolitical conflict, a major pipeline disruption, or a larger-than-expected inventory drop. Without positive news, the probability of this scenario is low. Range-Bound Scenario (25% probability): Fluctuations between $85.00 and $86.50 without a decisive breakout. This means the market is awaiting the weekly inventory report, which is the most common outcome when bullish and bearish forces are balanced. Cross-market correlation: Crude oil traders need to pay attention to signals from gold . Signals from the precious metals market deserve close attention from crude oil traders. Gold at $4643.02/oz and silver at $68.67/oz are rising not solely due to inflation expectations, but also because of declining real yields and the influx of safe-haven funds. When gold rises by more than 1% in a single day while crude oil falls by nearly 2%, the market is pricing in concerns about economic growth, not rising inflation. This is crucial. If the market were driven by inflation, gold and crude oil should rise in tandem, but currently their trends have diverged. Looking ahead, $85.56 is merely the midpoint of the trading range, not a directional decision point. $84.20-$87.10 is the main battleground for bulls and bears, and the term structure is the most important observation window; a flattening forward curve is itself a risk warning. The divergence between rising gold and falling crude oil represents concerns about growth, not inflation trading. Overall, a bearish scenario is more likely in the next 48 hours. Don't blindly chase the breakout; patiently wait for the price to close outside the range on the daily chart before making a judgment. The true downside target is $82.80. It's better to wait for confirmation signals than to blindly try to catch a falling knife.
- Risk Warning and Disclaimer
- The market involves risk, and trading may not be suitable for all investors. This article is for reference only and does not constitute personal investment advice, nor does it take into account certain users’ specific investment objectives, financial situation, or other needs. Any investment decisions made based on this information are at your own risk.