Why is gold still struggling even after oil prices fell below $100?
2026-09-23 19:22:11
On Wednesday, September 23, spot gold was trading around $4315 per ounce, down about 1% from the previous trading day. The market is digesting two opposing forces: on one hand, expectations of easing tensions in the Middle East have led to a decline in oil prices, thus easing inflationary and interest rate hike pressures; on the other hand, the US President reiterated at the UN General Assembly that an agreement with Iran would not be reached until after the November midterm elections, causing US Treasury yields and the dollar to strengthen, raising the cost of holding gold again. The Federal Reserve raised the target range for the federal funds rate by 25 basis points to 3.75% to 4.00% on September 16, the first rate hike since 2023. Later today, the preliminary reading of the US S&P Global PMI for September will be released. With this data window coinciding with geopolitical statements, gold's elasticity in response to interest rate expectations has been reopened. 
 The MACD parameters DIFF is -10.59, DEA is 0.44, and the histogram is below the zero line, reflecting that medium-term momentum has not yet returned above the zero line. The pullback after the surge pulled the price from the upper Bollinger Band back to the lower half of the band, and the trading rhythm shifted from one-sided to back-and-forth digestion. Before the dual variables of interest rates and geopolitics are fully priced in, the daily chart is more likely to show range-bound fluctuations around the middle band than an extension of a trend.
How geopolitical narratives and falling oil prices will rewrite inflation transmission
Gold's sensitivity to the US-Iran situation is not essentially driven by sentiment, but rather by the transmission of oil prices to the inflation path and then to nominal interest rates. This round of conflict pushed crude oil prices above $100, with the US August CPI rising 3.4% year-on-year, the energy component reaching a high of 16.3%, and core CPI at 2.4%, indicating a clear energy-driven inflation structure. In recent trading days, the market has traded on expectations of a de-escalation of the conflict and improved traffic in the Strait of Hormuz, causing West Texas Intermediate crude oil to fall back to around $89.5 per barrel, and Brent crude oil to trade around $99 per barrel, a significant pullback from mid-September highs. Lower oil prices will reduce the contribution of energy to CPI in the coming months, thus compressing the market's pricing space for aggressive interest rate hikes. As a zero-coupon asset, gold is highly sensitive to changes in real interest rates and the forward rate hike slope. It is important to note that a decline in oil prices does not automatically equate to the end of the conflict. On September 22, the US President stated at the UN General Assembly that he believed an agreement would be reached with Iran after the election, as the other side had no reason not to talk; he also denied that the election would influence the decision. This statement pushes back the timeline, partially withdraws the easing talks, and causes yields to rise in tandem with the dollar, putting downward pressure on gold. The core of pricing geopolitical variables has shifted from "whether talks will happen" to "whether oil prices can continue to fall before an agreement is reached."After the interest rate hike is implemented, yields and the US dollar will create holding constraints.
The Federal Reserve's September 16th policy meeting saw a 12-0 vote to raise interest rates, with the statement emphasizing that inflation remains high and that this action aims to return to the 2% target more quickly. The dot plot showed that most members expect further adjustments this year. Officials subsequently stated their intention to continue raising term premiums. Richmond Fed President Thomas Barkin, speaking in Baltimore on September 22nd, stated that inflation risks outweigh employment risks, which is the reason for the rate hike; whether further rate hikes will occur and by how much depends on whether price shocks subside or solidify. Boston Fed President Susan Collins stated on the same day that she supports last week's rate hike and believes the probability of inflation remaining significantly above 2% in future scenarios is increasing, and that slightly restrictive interest rates would help inflation sustainably decline. The 10-year Treasury yield is trading around 4.96%, the 2-year yield is close to 4.78%, and the dollar index has risen above 100.8. For gold, this is not simply a matter of "a rising dollar and falling gold prices," but rather the fact that the increased discount rate has compressed the relative attractiveness of non-interest-bearing assets. The market is roughly evenly split on the probability of an interest rate hike at the October 28-29 meeting. Once pricing is driven by data or official statements, gold price fluctuations often outpace changes in the fundamentals themselves.The daily chart structure indicates that the volatility has shifted from expansion to consolidation.
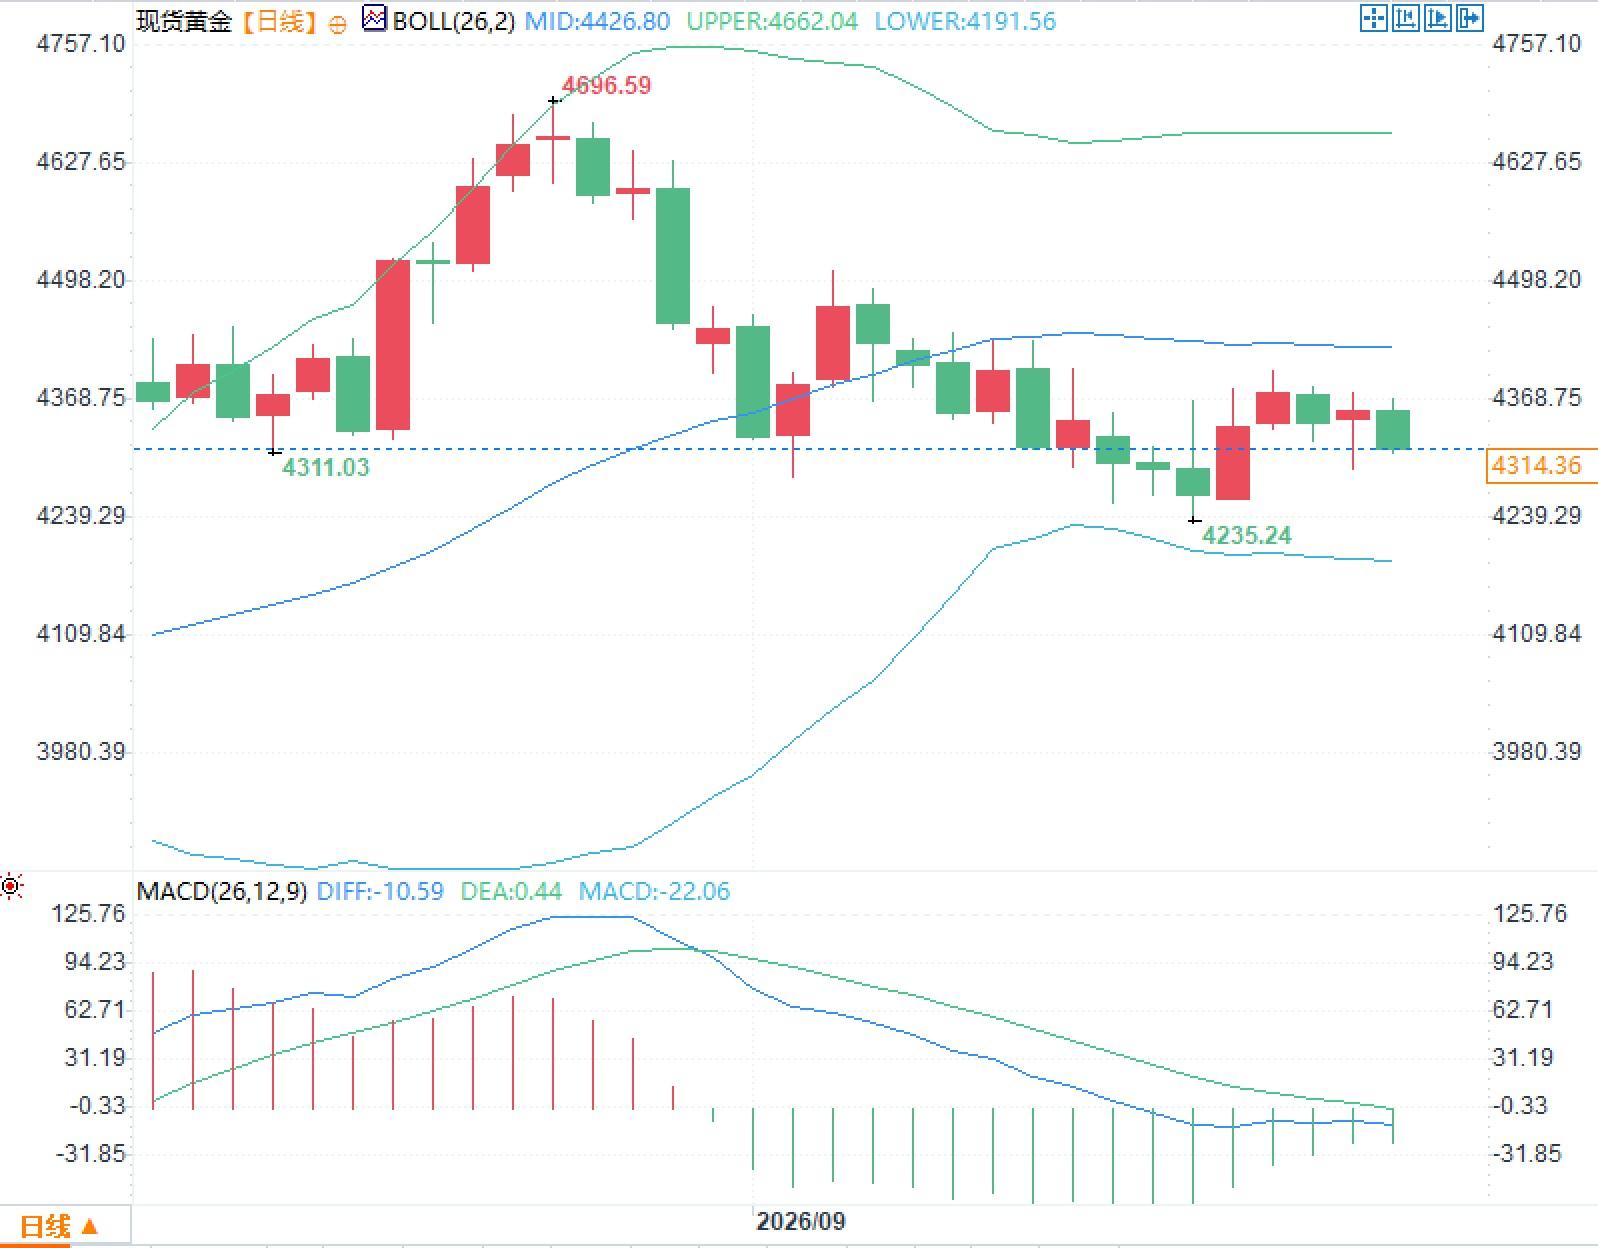
From a daily chart perspective, after retreating from its recent high of $4696.59, spot gold reached a low of $4235.24, with the price now trading between the Bollinger Band's middle band at $4426.80 and the lower band at $4191.56. The upper Bollinger Band is located at $4662.04, and the band width has narrowed compared to the previous surge, indicating that volatility has shifted from expansion to convergence. The MACD parameters DIFF is -10.59, DEA is 0.44, and the histogram is below the zero line, reflecting that medium-term momentum has not yet returned above the zero line. The pullback after the surge pulled the price from the upper Bollinger Band back to the lower half of the band, and the trading rhythm shifted from one-sided to back-and-forth digestion. Before the dual variables of interest rates and geopolitics are fully priced in, the daily chart is more likely to show range-bound fluctuations around the middle band than an extension of a trend.The data window will test the resilience of interest rate hike expectations.
Today's focus is on the preliminary S&P Global PMI for September in the United States. The market forecasts manufacturing at around 53.5 to 53.6 and services at around 56.0, both above the 50-point threshold separating expansion from contraction, but slightly lower than the final August reading. The significance of this data lies not in its absolute value, but in whether it can change the combination of "activity still expanding, inflation risks remaining." If both output and employment sub-indices weaken simultaneously, the market may lower its probability of another rate hike this year, leading to a decline in real interest rate expectations and easing the interest rate constraint on gold. If the price sub-indices are strong while demand remains stable, yields and the US dollar may once again become the dominant variables. Gold is currently trading simultaneously on oil prices, the election timeline, and the Fed's reaction function; marginal changes in any of these variables will be quickly reflected in gold prices through the interest rate channel. Going forward, it is necessary to pay attention to whether energy prices can rewrite the energy-driven inflation structure of August, and whether officials view the decline in oil prices as a temporary shock.- Risk Warning and Disclaimer
- The market involves risk, and trading may not be suitable for all investors. This article is for reference only and does not constitute personal investment advice, nor does it take into account certain users’ specific investment objectives, financial situation, or other needs. Any investment decisions made based on this information are at your own risk.