Gold prices fell further as the US September CPI exceeded expectations, hovering near key support levels and awaiting a directional move.
2026-10-15 11:34:18
International gold prices continued to be pressured after Wednesday's CPI data release, falling to around $4,100 per ounce in Asian trading on Thursday before rebounding to around $4,150. COMEX gold futures closed at $4,127.50 in the previous trading day, while spot gold touched a low of around $4,100 during the day. The decline in gold prices stemmed directly from the better-than-expected US inflation data – data released by the US Bureau of Labor Statistics on Wednesday showed that the September CPI rose 3.7% year-on-year, higher than the market expectation of 3.6% and the previous value of 3.4%, reaching the highest level in four months. Even more alarming for the market was the core CPI, which rose 2.6% year-on-year, higher than the expected 2.5% and the previous value of 2.4%; on a month-on-month basis, the overall CPI rose 0.6% (the largest increase in five months), and the core CPI rose 0.3%, both indicating that inflationary pressures are spreading to a wider range of economic sectors, rather than just remaining in the energy sector.  David Meg, head of metals trading at High Ridge Futures, said, "This currently means the Fed is more likely to raise rates," as CPI data continues to exceed the central bank's target level, and inflation stickiness is eroding the Fed's policy space to remain on hold. Market surveys show that the CME FedWatch Tool indicates the probability of an October rate hike has surged from about 22% before the CPI data release to 31.6%, while the probability of a December rate hike remains high at 89.7%. This repricing has directly pushed up US Treasury yields and the dollar—the 10-year Treasury yield has remained in a multi-year high range of 5.15% to 5.22%, and the dollar index, after closing at 102.18 on Tuesday, further strengthened to 102.51 on Wednesday, up 0.32%. For gold, which does not generate interest income, higher real interest rates and a stronger dollar mean a greater opportunity cost of holding, and the pressure to shift funds from non-interest-bearing assets to yield-generating assets continues to increase. Large-scale selling by CTA trend-following funds has become a direct driving force behind the decline in gold prices. In its latest report, TD Securities noted that "stronger inflation data is putting pressure on precious metals, with CTAs heavily selling gold and platinum." The report stated that "CTAs have become heavy sellers of gold after higher-than-expected inflation data and strong resistance around $4,200/oz." However, TD Securities also emphasized that hedging flows "ultimately provided strong support for gold," and "we expect these flows to remain robust, especially in the $4,000 to $4,100/oz range." This assessment aligns closely with the current market's structural characteristics—continued gold purchases by global central banks, robust ETF demand, and the presence of geopolitical risk premiums have collectively built a solid bottom around $4,000. San Francisco Fed President Mary Daly's speech on Wednesday provided a more detailed interpretation of the Fed's policy path. Daly's speech received a tracking score of 6.8 out of 10, slightly above her historical average of 6.1, releasing a "firm but not panicked" hawkish signal. She emphasized that overall CPI, driven by gasoline prices, is rising, while core inflation remains stubborn. Further rate hikes are "possible," but the timing should be "prudent and well-considered." Daly's assessment of the risks of persistently above-target inflation, a stable labor market, and market confidence in the Fed's reaction function collectively constitutes a policy tone that maintains a tightening bias but avoids hasty action. The Fed sentiment index fell slightly by 0.84 points to 128.17. While still in clearly hawkish territory (above the 100 neutral line), the slight decline suggests that even with higher-than-expected CPI, Fed officials are still finding a balance between a "hawkish stance" and "data-dependent patience." The market will face further tests of inflation clues tonight. The US September Producer Price Index (PPI) and retail sales data will be released on Thursday. The Producer Price Index (PPI) will reveal the depth and breadth of energy cost transmission downstream from the wholesale end. If the PPI also exceeds expectations, it will further strengthen market concerns about expanding inflation, potentially pushing up the pricing of an October rate hike and putting new downward pressure on gold prices. If the PPI is moderate, it may alleviate market panic about "comprehensive inflation" in the CPI data, providing breathing room for gold prices to stabilize around $4,000. Retail sales data will test the resilience of US consumer spending. If consumption remains strong, it will provide evidence for the Fed's hawkish narrative of "demand-driven inflation." If consumption slows significantly, it may activate the gold price support logic of "economic downturn → easing expectations." From the perspective of gold's own market structure, allocation funds are still providing a solid bottom for gold prices. Data from the World Gold Council shows that global gold ETFs saw net inflows of approximately $10 billion in September, pushing the cumulative net inflows in the third quarter to a record $31 billion, and global gold ETF holdings climbed to a record high of 4,256 tons. Central banks in major Asian countries have increased their gold holdings for the 23rd consecutive month, adding 740,000 ounces in September to reach 77.47 million ounces, the largest monthly increase since the start of this buying cycle. Goldman Sachs predicts that nearly all of the approximately 23% increase in gold prices by the end of 2027 will be driven by central bank demand. These structural purchases are insensitive to short-term interest rate fluctuations and were particularly active when gold prices pulled back to the $4,000 to $4,100 range, forming a solid bottom support to counteract CTA selling pressure. From a technical perspective, gold maintains a bearish bias on the daily chart, with the price consistently trading below the 20-day Bollinger Band middle line and the 100-day simple moving average, maintaining its recent bearish tone. Prices are drifting towards the lower half of the recent trading range. The 14-day Relative Strength Index (RSI) is around 38.73, in the neutral-to-weak zone but not yet in the typical oversold zone, indicating that selling pressure exists but has not yet reached extreme levels—meaning that downward pressure continues, but the selling pressure is not far from exhaustion. The MACD indicator has formed a gentle golden cross below the zero line, and the RSI is rebounding towards the neutral zone, revealing early signs of a bottoming out. The Bollinger Band middle line at approximately $4210 forms the first key resistance, followed by the 100-day moving average at approximately $4250, both forming a dense supply area. Stronger resistance lies at the upper Bollinger Band at approximately $4390; a corrective rebound extending to this level would face heavy selling pressure. On the downside, the lower Bollinger Band at approximately $4035 forms the most immediate downside defense, which is also the lower edge of the "strong support zone of $4000 to $4100" mentioned by TD Securities. If short sellers take profits in this area, or if more meaningful buying pressure emerges, gold prices are expected to find support at this level. However, if the price continues to break below $4035 and effectively breaches the psychological level of $4000, a deeper correction should be anticipated, with downside targets at the June low of $3955 and even the $3800 to $3900 area. From a 4-hour chart perspective, gold prices have been consolidating weakly after falling from their highs. Short-term moving averages are flat, the MACD bearish momentum has weakened but has not yet formed a golden cross, and the RSI is in the weak zone around 40. The key short-term support is in the $4065-$4100 range, which is a convergence of the lower Bollinger Band, a previous area of high trading volume, and a support zone marked by TD Securities. Immediate resistance is at $4150-$4165. A successful break and hold above this level could trigger short covering and push gold prices towards the $4210 Bollinger Band middle line.
 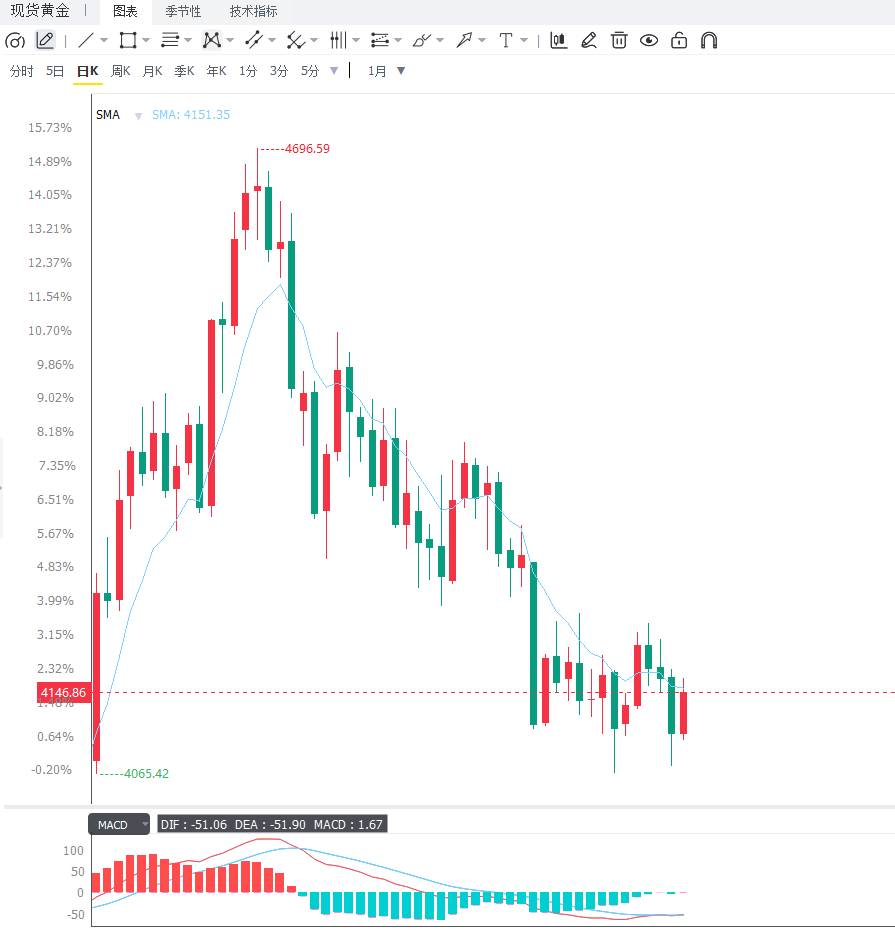 Editor's Summary: Gold is currently embroiled in a crucial struggle between "higher-than-expected CPI triggering interest rate hike panic" and "support from $4,000 allocation-oriented buying." The US September CPI and core CPI both exceeded market expectations, pushing the probability of an October rate hike from 22% to 31.6%. CTA trend-following funds sold off heavily, putting pressure on gold prices, which fell to around $4,100. However, San Francisco Fed President Daly's statement that "rate hikes are possible but require caution" indicates that the Fed has not entered a panic tightening mode. Continued global central bank buying, record ETF inflows, and the existence of geopolitical risk premiums have collectively built a solid bottom line in the $4,000 to $4,100 range. TD Securities explicitly stated that "these supporting fund flows are expected to remain robust, especially in the $4,000 to $4,100 range." Looking ahead, tonight's US PPI and retail sales data will be key variables for short-term direction. A moderate PPI coupled with a slowdown in retail sales may alleviate inflation fears, and gold prices are expected to stabilize in the $4065-$4100 range and rebound towards $4150-$4210. Conversely, a strong PPI coupled with resilient consumption may further solidify the hawkish narrative, and gold prices face the risk of breaking below the lower Bollinger Band at $4035 and experiencing a deeper correction to $3955 or even $3800.
David Meg, head of metals trading at High Ridge Futures, said, "This currently means the Fed is more likely to raise rates," as CPI data continues to exceed the central bank's target level, and inflation stickiness is eroding the Fed's policy space to remain on hold. Market surveys show that the CME FedWatch Tool indicates the probability of an October rate hike has surged from about 22% before the CPI data release to 31.6%, while the probability of a December rate hike remains high at 89.7%. This repricing has directly pushed up US Treasury yields and the dollar—the 10-year Treasury yield has remained in a multi-year high range of 5.15% to 5.22%, and the dollar index, after closing at 102.18 on Tuesday, further strengthened to 102.51 on Wednesday, up 0.32%. For gold, which does not generate interest income, higher real interest rates and a stronger dollar mean a greater opportunity cost of holding, and the pressure to shift funds from non-interest-bearing assets to yield-generating assets continues to increase. Large-scale selling by CTA trend-following funds has become a direct driving force behind the decline in gold prices. In its latest report, TD Securities noted that "stronger inflation data is putting pressure on precious metals, with CTAs heavily selling gold and platinum." The report stated that "CTAs have become heavy sellers of gold after higher-than-expected inflation data and strong resistance around $4,200/oz." However, TD Securities also emphasized that hedging flows "ultimately provided strong support for gold," and "we expect these flows to remain robust, especially in the $4,000 to $4,100/oz range." This assessment aligns closely with the current market's structural characteristics—continued gold purchases by global central banks, robust ETF demand, and the presence of geopolitical risk premiums have collectively built a solid bottom around $4,000. San Francisco Fed President Mary Daly's speech on Wednesday provided a more detailed interpretation of the Fed's policy path. Daly's speech received a tracking score of 6.8 out of 10, slightly above her historical average of 6.1, releasing a "firm but not panicked" hawkish signal. She emphasized that overall CPI, driven by gasoline prices, is rising, while core inflation remains stubborn. Further rate hikes are "possible," but the timing should be "prudent and well-considered." Daly's assessment of the risks of persistently above-target inflation, a stable labor market, and market confidence in the Fed's reaction function collectively constitutes a policy tone that maintains a tightening bias but avoids hasty action. The Fed sentiment index fell slightly by 0.84 points to 128.17. While still in clearly hawkish territory (above the 100 neutral line), the slight decline suggests that even with higher-than-expected CPI, Fed officials are still finding a balance between a "hawkish stance" and "data-dependent patience." The market will face further tests of inflation clues tonight. The US September Producer Price Index (PPI) and retail sales data will be released on Thursday. The Producer Price Index (PPI) will reveal the depth and breadth of energy cost transmission downstream from the wholesale end. If the PPI also exceeds expectations, it will further strengthen market concerns about expanding inflation, potentially pushing up the pricing of an October rate hike and putting new downward pressure on gold prices. If the PPI is moderate, it may alleviate market panic about "comprehensive inflation" in the CPI data, providing breathing room for gold prices to stabilize around $4,000. Retail sales data will test the resilience of US consumer spending. If consumption remains strong, it will provide evidence for the Fed's hawkish narrative of "demand-driven inflation." If consumption slows significantly, it may activate the gold price support logic of "economic downturn → easing expectations." From the perspective of gold's own market structure, allocation funds are still providing a solid bottom for gold prices. Data from the World Gold Council shows that global gold ETFs saw net inflows of approximately $10 billion in September, pushing the cumulative net inflows in the third quarter to a record $31 billion, and global gold ETF holdings climbed to a record high of 4,256 tons. Central banks in major Asian countries have increased their gold holdings for the 23rd consecutive month, adding 740,000 ounces in September to reach 77.47 million ounces, the largest monthly increase since the start of this buying cycle. Goldman Sachs predicts that nearly all of the approximately 23% increase in gold prices by the end of 2027 will be driven by central bank demand. These structural purchases are insensitive to short-term interest rate fluctuations and were particularly active when gold prices pulled back to the $4,000 to $4,100 range, forming a solid bottom support to counteract CTA selling pressure. From a technical perspective, gold maintains a bearish bias on the daily chart, with the price consistently trading below the 20-day Bollinger Band middle line and the 100-day simple moving average, maintaining its recent bearish tone. Prices are drifting towards the lower half of the recent trading range. The 14-day Relative Strength Index (RSI) is around 38.73, in the neutral-to-weak zone but not yet in the typical oversold zone, indicating that selling pressure exists but has not yet reached extreme levels—meaning that downward pressure continues, but the selling pressure is not far from exhaustion. The MACD indicator has formed a gentle golden cross below the zero line, and the RSI is rebounding towards the neutral zone, revealing early signs of a bottoming out. The Bollinger Band middle line at approximately $4210 forms the first key resistance, followed by the 100-day moving average at approximately $4250, both forming a dense supply area. Stronger resistance lies at the upper Bollinger Band at approximately $4390; a corrective rebound extending to this level would face heavy selling pressure. On the downside, the lower Bollinger Band at approximately $4035 forms the most immediate downside defense, which is also the lower edge of the "strong support zone of $4000 to $4100" mentioned by TD Securities. If short sellers take profits in this area, or if more meaningful buying pressure emerges, gold prices are expected to find support at this level. However, if the price continues to break below $4035 and effectively breaches the psychological level of $4000, a deeper correction should be anticipated, with downside targets at the June low of $3955 and even the $3800 to $3900 area. From a 4-hour chart perspective, gold prices have been consolidating weakly after falling from their highs. Short-term moving averages are flat, the MACD bearish momentum has weakened but has not yet formed a golden cross, and the RSI is in the weak zone around 40. The key short-term support is in the $4065-$4100 range, which is a convergence of the lower Bollinger Band, a previous area of high trading volume, and a support zone marked by TD Securities. Immediate resistance is at $4150-$4165. A successful break and hold above this level could trigger short covering and push gold prices towards the $4210 Bollinger Band middle line. Editor's Summary: Gold is currently embroiled in a crucial struggle between "higher-than-expected CPI triggering interest rate hike panic" and "support from $4,000 allocation-oriented buying." The US September CPI and core CPI both exceeded market expectations, pushing the probability of an October rate hike from 22% to 31.6%. CTA trend-following funds sold off heavily, putting pressure on gold prices, which fell to around $4,100. However, San Francisco Fed President Daly's statement that "rate hikes are possible but require caution" indicates that the Fed has not entered a panic tightening mode. Continued global central bank buying, record ETF inflows, and the existence of geopolitical risk premiums have collectively built a solid bottom line in the $4,000 to $4,100 range. TD Securities explicitly stated that "these supporting fund flows are expected to remain robust, especially in the $4,000 to $4,100 range." Looking ahead, tonight's US PPI and retail sales data will be key variables for short-term direction. A moderate PPI coupled with a slowdown in retail sales may alleviate inflation fears, and gold prices are expected to stabilize in the $4065-$4100 range and rebound towards $4150-$4210. Conversely, a strong PPI coupled with resilient consumption may further solidify the hawkish narrative, and gold prices face the risk of breaking below the lower Bollinger Band at $4035 and experiencing a deeper correction to $3955 or even $3800.
- Risk Warning and Disclaimer
- The market involves risk, and trading may not be suitable for all investors. This article is for reference only and does not constitute personal investment advice, nor does it take into account certain users’ specific investment objectives, financial situation, or other needs. Any investment decisions made based on this information are at your own risk.