Ahead of the Fed's decision, gold prices fluctuated around the $4,000 mark, awaiting a directional move.
2026-10-28 10:12:23
Gold traded around $4,050 in early Asian trading on Wednesday, a rapid rise from the $4,000 level of the previous two days. The immediate driver of this rebound was oil prices: crude oil fell for the second consecutive trading day as market attention shifted to Middle East peace talks. This shift removed the most active link in the "inflation-tightening" chain, giving gold some breathing room. However, any renewed tensions surrounding the US-Iran conflict and the Houthi-Saudi clashes could push up energy prices and reignite inflation concerns, thus strengthening the case for central banks to tighten monetary policy, creating headwinds for gold prices. This structure of "reasonable rises, but reversible reasons" suggests that this rebound is more of a valuation correction after the headwinds have weakened, rather than the starting point of a trend reversal.  From a supporting perspective, the mechanism behind the oil price decline is twofold. On the one hand, it lowers inflation readings on the cost side, weakening the urgency for further tightening by the Federal Reserve; on the other hand, it also weakens the geopolitical safe-haven narrative itself—the same round of diplomatic progress simultaneously affects both crude oil and gold, with the former benefiting while the latter faces a loss of safe-haven demand. Grant's assessment points out the current reality: the rise in gold prices stems more from easing headwinds than from strengthening tailwinds. This has clear implications for investors: gains driven by the easing of counterparty pressure are naturally less sustainable than gains driven by incremental funds. Scotiabank's observations also confirm this—the bank describes gold as "increasingly vulnerable," while describing copper as a "tentative continuation of the recovery from the lower end of the range." This divergence suggests that the current weakness in precious metals stems more from their own logic than from a comprehensive sell-off of risk assets. Policy expectations, on the other hand, set a ceiling from another perspective. Although Wednesday's hold-up was fully priced in (the probability of a rate hike is only about 6.6%), the probability of a rate hike in December remains as high as 84.4%, and the year-end holding cost pressure has not been relieved. For non-interest-bearing gold, this directly increases the opportunity cost of holding positions. The FXS Fed Sentiment Index remained unchanged at a high of 127.51, indicating that the overall policy narrative remains firmly in the hawkish range. Warsh's speech score of 5.6/10, slightly below the historical average of 6.1/10, was cautious and refused to predict FOMC decisions, emphasizing AI as a demand-side force and a tool to enhance data confidence, while acknowledging that he was "too deeply wounded by the global financial crisis." This combination of "optimism about structure and caution about pace" supports the dollar, while for gold, it means that the meeting itself is unlikely to provide incremental positive news; what can truly change the landscape is whether the central level of real interest rates will loosen. In addition, the US PCE price index released on Thursday is the most crucial indicator that the Fed is watching. If the data is stronger than expected, it could quickly weaken the positive foundation established by the current oil price decline, which is a time risk that short-term bulls must face squarely. Compared with other assets, the complexity of the current environment is further highlighted. In the energy market, "crude oil prices appear to have entered a narrow consolidation range, with WTI holding steady above $100/barrel and Brent crude above $115/barrel"; in the stock market, "global stock indices showed divergent performance, with China's CSI index weakening significantly, in stark contrast to South Korea's Kospi index's 3% gain," and European stock markets generally weak. This backdrop of "commodity consolidation and equity divergence" means that gold has neither been dragged down by a sell-off of systemically risky assets nor has it received a concentrated inflow of safe-haven funds—it is in a neutral environment lacking directional catalysts. The continued decline in silver is the most alarming signal. Scotiabank explicitly points out that "the continued decline in silver has clearly tilted the balance downwards." Because silver has a heavier speculative position and a shallower market depth, its downward breakout often exerts downward pressure on gold through the gold-silver ratio and sentiment channels; if silver cannot stabilize, gold's defense above $4,000 will face a greater test. From a cross-asset perspective, the current volatility in gold is essentially a confluence of four factors: first, the proactive easing of pressure from falling oil prices through inflation and interest rates; second, the reverse drag from easing geopolitical tensions weakening safe-haven demand; third, the valuation ceiling created by the undisproven year-end path of the Federal Reserve; and fourth, the emotional suppression brought about by the breakdown in silver prices. Of these four forces, only the first is clearly bullish, while the other three are either neutral to bearish or directly bearish. After these three factors offset each other, the net direction of gold depends more on real interest rates than on geopolitical narratives. This also explains why, during this round of easing tensions, gold's performance has consistently lagged behind the decline in crude oil prices—it is simultaneously subjected to pressure from both pricing and sentiment. Investors should not view the single-day jump in gold prices in isolation, but rather evaluate it within the transmission chain of "oil prices—inflation—real interest rates—exchange rates": only when there is a substantial easing at the interest rate end of this chain will the bottom of gold's price range be credible. On the daily chart, spot gold is trading around $4050, with a short-term bias still bearish. The price is trading below the 20-day Bollinger Band middle line and the 100-day moving average, both of which are suppressing upward movement, indicating that the previous upward trend is losing momentum. The price is also well below the upper Bollinger Band, suggesting the market has retreated from previous extreme highs. The RSI is at 41, slightly negative, suggesting that selling pressure still dominates the rebound, a typical "oversold correction, no trend reversal" pattern. The next resistance levels to watch are the 20-day Bollinger Band middle line around $4125, the 100-day moving average around $4220, and the upper Bollinger Band around $4235—only a break above this area can restart a stronger bullish trend. On the downside, the first support level is the lower Bollinger Band around $4015. If the daily candle closes below this level, it will open up more room for correction; holding this level will keep the price in a consolidation pullback rather than a full trend reversal. On the 4-hour chart, gold prices surged from around $4,010 and then moved up along the short-term moving average. The MACD histogram rebounded from below the zero line, and the fast and slow lines are approaching a golden cross, indicating a shift in momentum from bearish to bullish, but this has not yet been confirmed.
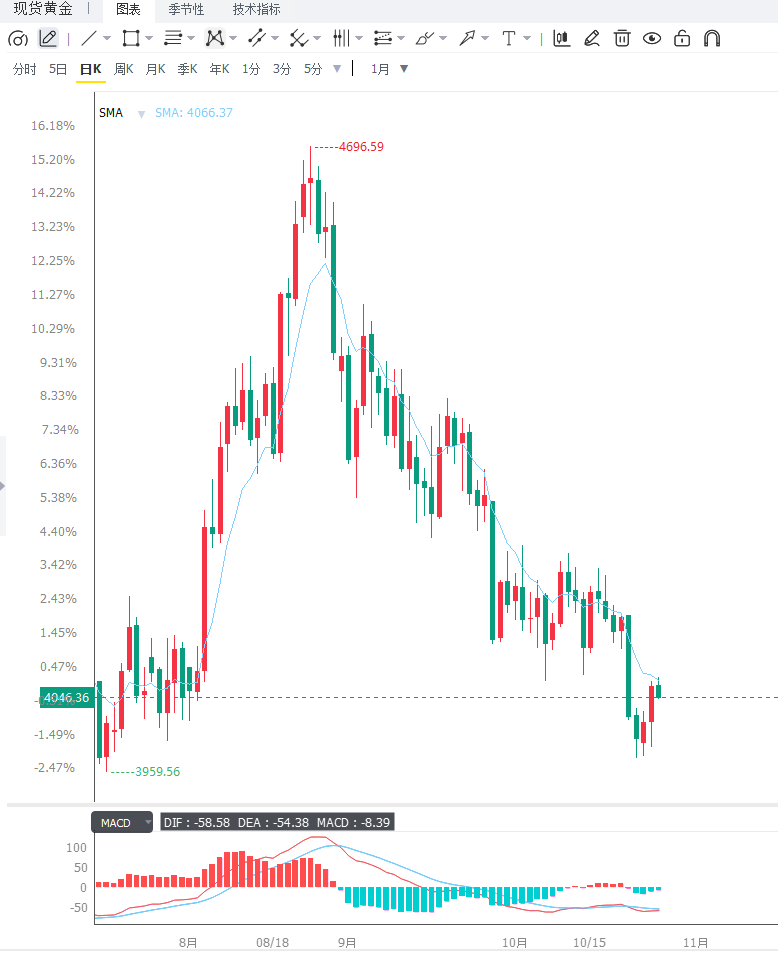 Editor's Summary: The core contradiction for gold in the short term lies in the fact that the decline in oil prices has eased the headwinds of inflation and tightening, and the Fed's decision to hold rates steady has already been fully priced in, providing support. Meanwhile, the high probability of a December rate hike, easing geopolitical tensions reducing safe-haven demand, and the continued pressure from silver's breakout, all contribute to a two-way driver that gold prices are more likely to consolidate within the $4040-$4125 range, awaiting a decision and data release. Three key variables need to be monitored: first, the Fed's interest rate decision, policy statement, and Warsh press conference, which, without updated economic forecasts, will directly determine the year-end holding cost basis; second, the US PCE price index on Thursday, the Fed's most valued inflation indicator, whose strength or weakness will verify the strength of the positive foundation established by the current oil price decline; and third, the trends of Brent and WTI crude oil and the progress of Middle East peace talks, which are prerequisites for the transmission chains of inflation expectations and safe-haven demand. In addition, whether silver can stabilize, the gold-silver ratio, and whether the recovery of copper can spread to the precious metals sector also need to be monitored.
From a supporting perspective, the mechanism behind the oil price decline is twofold. On the one hand, it lowers inflation readings on the cost side, weakening the urgency for further tightening by the Federal Reserve; on the other hand, it also weakens the geopolitical safe-haven narrative itself—the same round of diplomatic progress simultaneously affects both crude oil and gold, with the former benefiting while the latter faces a loss of safe-haven demand. Grant's assessment points out the current reality: the rise in gold prices stems more from easing headwinds than from strengthening tailwinds. This has clear implications for investors: gains driven by the easing of counterparty pressure are naturally less sustainable than gains driven by incremental funds. Scotiabank's observations also confirm this—the bank describes gold as "increasingly vulnerable," while describing copper as a "tentative continuation of the recovery from the lower end of the range." This divergence suggests that the current weakness in precious metals stems more from their own logic than from a comprehensive sell-off of risk assets. Policy expectations, on the other hand, set a ceiling from another perspective. Although Wednesday's hold-up was fully priced in (the probability of a rate hike is only about 6.6%), the probability of a rate hike in December remains as high as 84.4%, and the year-end holding cost pressure has not been relieved. For non-interest-bearing gold, this directly increases the opportunity cost of holding positions. The FXS Fed Sentiment Index remained unchanged at a high of 127.51, indicating that the overall policy narrative remains firmly in the hawkish range. Warsh's speech score of 5.6/10, slightly below the historical average of 6.1/10, was cautious and refused to predict FOMC decisions, emphasizing AI as a demand-side force and a tool to enhance data confidence, while acknowledging that he was "too deeply wounded by the global financial crisis." This combination of "optimism about structure and caution about pace" supports the dollar, while for gold, it means that the meeting itself is unlikely to provide incremental positive news; what can truly change the landscape is whether the central level of real interest rates will loosen. In addition, the US PCE price index released on Thursday is the most crucial indicator that the Fed is watching. If the data is stronger than expected, it could quickly weaken the positive foundation established by the current oil price decline, which is a time risk that short-term bulls must face squarely. Compared with other assets, the complexity of the current environment is further highlighted. In the energy market, "crude oil prices appear to have entered a narrow consolidation range, with WTI holding steady above $100/barrel and Brent crude above $115/barrel"; in the stock market, "global stock indices showed divergent performance, with China's CSI index weakening significantly, in stark contrast to South Korea's Kospi index's 3% gain," and European stock markets generally weak. This backdrop of "commodity consolidation and equity divergence" means that gold has neither been dragged down by a sell-off of systemically risky assets nor has it received a concentrated inflow of safe-haven funds—it is in a neutral environment lacking directional catalysts. The continued decline in silver is the most alarming signal. Scotiabank explicitly points out that "the continued decline in silver has clearly tilted the balance downwards." Because silver has a heavier speculative position and a shallower market depth, its downward breakout often exerts downward pressure on gold through the gold-silver ratio and sentiment channels; if silver cannot stabilize, gold's defense above $4,000 will face a greater test. From a cross-asset perspective, the current volatility in gold is essentially a confluence of four factors: first, the proactive easing of pressure from falling oil prices through inflation and interest rates; second, the reverse drag from easing geopolitical tensions weakening safe-haven demand; third, the valuation ceiling created by the undisproven year-end path of the Federal Reserve; and fourth, the emotional suppression brought about by the breakdown in silver prices. Of these four forces, only the first is clearly bullish, while the other three are either neutral to bearish or directly bearish. After these three factors offset each other, the net direction of gold depends more on real interest rates than on geopolitical narratives. This also explains why, during this round of easing tensions, gold's performance has consistently lagged behind the decline in crude oil prices—it is simultaneously subjected to pressure from both pricing and sentiment. Investors should not view the single-day jump in gold prices in isolation, but rather evaluate it within the transmission chain of "oil prices—inflation—real interest rates—exchange rates": only when there is a substantial easing at the interest rate end of this chain will the bottom of gold's price range be credible. On the daily chart, spot gold is trading around $4050, with a short-term bias still bearish. The price is trading below the 20-day Bollinger Band middle line and the 100-day moving average, both of which are suppressing upward movement, indicating that the previous upward trend is losing momentum. The price is also well below the upper Bollinger Band, suggesting the market has retreated from previous extreme highs. The RSI is at 41, slightly negative, suggesting that selling pressure still dominates the rebound, a typical "oversold correction, no trend reversal" pattern. The next resistance levels to watch are the 20-day Bollinger Band middle line around $4125, the 100-day moving average around $4220, and the upper Bollinger Band around $4235—only a break above this area can restart a stronger bullish trend. On the downside, the first support level is the lower Bollinger Band around $4015. If the daily candle closes below this level, it will open up more room for correction; holding this level will keep the price in a consolidation pullback rather than a full trend reversal. On the 4-hour chart, gold prices surged from around $4,010 and then moved up along the short-term moving average. The MACD histogram rebounded from below the zero line, and the fast and slow lines are approaching a golden cross, indicating a shift in momentum from bearish to bullish, but this has not yet been confirmed. Editor's Summary: The core contradiction for gold in the short term lies in the fact that the decline in oil prices has eased the headwinds of inflation and tightening, and the Fed's decision to hold rates steady has already been fully priced in, providing support. Meanwhile, the high probability of a December rate hike, easing geopolitical tensions reducing safe-haven demand, and the continued pressure from silver's breakout, all contribute to a two-way driver that gold prices are more likely to consolidate within the $4040-$4125 range, awaiting a decision and data release. Three key variables need to be monitored: first, the Fed's interest rate decision, policy statement, and Warsh press conference, which, without updated economic forecasts, will directly determine the year-end holding cost basis; second, the US PCE price index on Thursday, the Fed's most valued inflation indicator, whose strength or weakness will verify the strength of the positive foundation established by the current oil price decline; and third, the trends of Brent and WTI crude oil and the progress of Middle East peace talks, which are prerequisites for the transmission chains of inflation expectations and safe-haven demand. In addition, whether silver can stabilize, the gold-silver ratio, and whether the recovery of copper can spread to the precious metals sector also need to be monitored.
- Risk Warning and Disclaimer
- The market involves risk, and trading may not be suitable for all investors. This article is for reference only and does not constitute personal investment advice, nor does it take into account certain users’ specific investment objectives, financial situation, or other needs. Any investment decisions made based on this information are at your own risk.