













Preliminary midterm election results triggered a sell-off, pushing the dollar index to its lowest level since late September.
2026-11-04 15:44:28
On Wednesday during Asian trading hours, the dollar index, which measures the dollar's performance against a basket of major currencies, experienced a concentrated sell-off, falling to 101.25, its lowest level since the end of September. Early vote counts in the US midterm elections altered market expectations, with trading now pricing in the possibility of Democrats gaining control of both the House and Senate. The market generally interprets this as a Democratic sweep of both houses of Congress, which would likely lead to a policy deadlock, significantly increasing the difficulty of passing fiscal expansion and large-scale spending bills, weakening fiscal stimulus, and consequently cooling medium- to long-term economic growth expectations.  Under these expectations, funds began to seek safe havens, continuously flowing into the US Treasury market. The yield curve for US Treasuries declined across the board, increasing the attractiveness of zero-interest-rate Treasuries and directly weakening the dollar's interest rate advantage, becoming the core driver of the dollar index's weakness during the day. However, the dollar's decline is not unilateral; two supporting factors constrain the downside, and aggressive short selling requires caution. EMC Group's FedWatch tool shows that the market is currently pricing in a greater than 75% probability of another Fed rate hike in December. The JOLTS job openings data released Tuesday evening reinforced this expectation, with job openings rising from 7.2 million to 7.5 million in September, significantly exceeding market expectations. The labor market remains resilient, and coupled with the stickiness of inflation from energy prices, this continues to solidify market bets on a Fed tightening policy, forming underlying support for the dollar. The Middle East geopolitical situation remains complex, and risk premiums have not been fully cleared. Trump's public statement that the US has no immediate plans to strike Iran, a clear divergence from the Israeli Prime Minister's hints of an attack, has dampened market expectations for a de-escalation of the conflict. However, Iran has sent a strong signal, with senior Iranian officials stating that the Strait of Hormuz will only reopen to normal navigation if the US lifts sanctions and the maritime blockade. Simultaneously, the Iranian Revolutionary Guard reported that four oil tankers were damaged by mines in the southern waters of the Strait of Hormuz, further escalating shipping risks. With expectations of easing diplomatic tensions on one hand, and substantial disruption to shipping in the Strait on the other, the interplay of these factors has led to fluctuating geopolitical safe-haven demand, intermittently providing buying support for the US dollar. Short-term market movements will be dominated by North American data releases, with the US ADP private sector employment data and the ISM services PMI to be released Wednesday evening. The ADP data is used to anticipate the strength of non-farm payrolls, while the ISM services PMI reflects the state of US domestic demand. If both data significantly exceed expectations, it will quickly correct expectations of a Fed rate hike, leading to a rebound in US Treasury yields and a recovery in the US dollar; conversely, weaker data could open further downside potential for the dollar. In addition to economic data, subsequent vote counting progress and unexpected news related to the Middle East Straits could also cause momentary volatility. The highlight of the week remains Friday's non-farm payroll report, which will ultimately set the tone for the Federal Reserve's monetary policy path at the end of the year and is the core focus of the entire market. On the daily chart, the US dollar index has weakened in the short term, with the price testing the key support level of 101.26. The RSI indicator has fallen from its high, indicating a significant weakening of upward momentum. The medium-term bullish structure has not been completely destroyed. If the 101.26 support holds, there is still a chance for a corrective rebound; however, a decisive break below this level would open up further downside potential. On the 4-hour chart, the US dollar index maintains a short-term bearish bias, having already broken below the 4-hour 200-period simple moving average. If the price continues to decline below the 38.2% Fibonacci retracement level of 101.26, the downside target is 100.75, with a further target of 100.24; larger support levels are at 99.51 and 98.59. The initial resistance level is the 4-hour 200-period moving average at 101.71, followed by the 23.6% Fibonacci retracement level at 101.89, and the important cycle high resistance at 102.92. Only a retest of 101.71 will alleviate the short-term bearish trend.
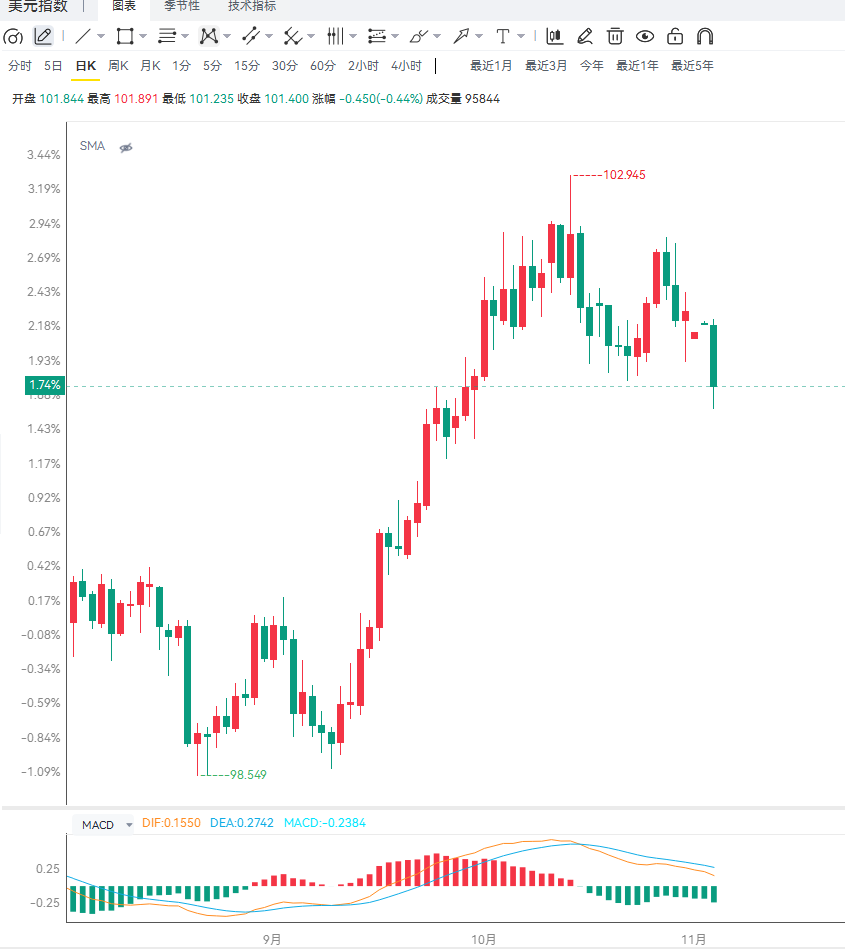 Editor's Summary: The US dollar index experienced a rapid pullback following the initial midterm election results, with declining US Treasury yields exerting significant downward pressure. However, the high probability of a Fed rate hike and geopolitical conflicts in the Middle East provided support for the dollar, intensifying the battle between bulls and bears. The short-term risk lies in continued downward pressure on the dollar following the election, potentially breaking through key support levels. A potential opportunity is a strong US employment data release, which could drive the dollar back up to test resistance. The key level to watch is the effectiveness of the 101.26 support level; close attention should be paid to ADP, ISM, and subsequent non-farm payroll data, as event-driven market volatility is high.
Under these expectations, funds began to seek safe havens, continuously flowing into the US Treasury market. The yield curve for US Treasuries declined across the board, increasing the attractiveness of zero-interest-rate Treasuries and directly weakening the dollar's interest rate advantage, becoming the core driver of the dollar index's weakness during the day. However, the dollar's decline is not unilateral; two supporting factors constrain the downside, and aggressive short selling requires caution. EMC Group's FedWatch tool shows that the market is currently pricing in a greater than 75% probability of another Fed rate hike in December. The JOLTS job openings data released Tuesday evening reinforced this expectation, with job openings rising from 7.2 million to 7.5 million in September, significantly exceeding market expectations. The labor market remains resilient, and coupled with the stickiness of inflation from energy prices, this continues to solidify market bets on a Fed tightening policy, forming underlying support for the dollar. The Middle East geopolitical situation remains complex, and risk premiums have not been fully cleared. Trump's public statement that the US has no immediate plans to strike Iran, a clear divergence from the Israeli Prime Minister's hints of an attack, has dampened market expectations for a de-escalation of the conflict. However, Iran has sent a strong signal, with senior Iranian officials stating that the Strait of Hormuz will only reopen to normal navigation if the US lifts sanctions and the maritime blockade. Simultaneously, the Iranian Revolutionary Guard reported that four oil tankers were damaged by mines in the southern waters of the Strait of Hormuz, further escalating shipping risks. With expectations of easing diplomatic tensions on one hand, and substantial disruption to shipping in the Strait on the other, the interplay of these factors has led to fluctuating geopolitical safe-haven demand, intermittently providing buying support for the US dollar. Short-term market movements will be dominated by North American data releases, with the US ADP private sector employment data and the ISM services PMI to be released Wednesday evening. The ADP data is used to anticipate the strength of non-farm payrolls, while the ISM services PMI reflects the state of US domestic demand. If both data significantly exceed expectations, it will quickly correct expectations of a Fed rate hike, leading to a rebound in US Treasury yields and a recovery in the US dollar; conversely, weaker data could open further downside potential for the dollar. In addition to economic data, subsequent vote counting progress and unexpected news related to the Middle East Straits could also cause momentary volatility. The highlight of the week remains Friday's non-farm payroll report, which will ultimately set the tone for the Federal Reserve's monetary policy path at the end of the year and is the core focus of the entire market. On the daily chart, the US dollar index has weakened in the short term, with the price testing the key support level of 101.26. The RSI indicator has fallen from its high, indicating a significant weakening of upward momentum. The medium-term bullish structure has not been completely destroyed. If the 101.26 support holds, there is still a chance for a corrective rebound; however, a decisive break below this level would open up further downside potential. On the 4-hour chart, the US dollar index maintains a short-term bearish bias, having already broken below the 4-hour 200-period simple moving average. If the price continues to decline below the 38.2% Fibonacci retracement level of 101.26, the downside target is 100.75, with a further target of 100.24; larger support levels are at 99.51 and 98.59. The initial resistance level is the 4-hour 200-period moving average at 101.71, followed by the 23.6% Fibonacci retracement level at 101.89, and the important cycle high resistance at 102.92. Only a retest of 101.71 will alleviate the short-term bearish trend. Editor's Summary: The US dollar index experienced a rapid pullback following the initial midterm election results, with declining US Treasury yields exerting significant downward pressure. However, the high probability of a Fed rate hike and geopolitical conflicts in the Middle East provided support for the dollar, intensifying the battle between bulls and bears. The short-term risk lies in continued downward pressure on the dollar following the election, potentially breaking through key support levels. A potential opportunity is a strong US employment data release, which could drive the dollar back up to test resistance. The key level to watch is the effectiveness of the 101.26 support level; close attention should be paid to ADP, ISM, and subsequent non-farm payroll data, as event-driven market volatility is high.
- Risk Warning and Disclaimer
- The market involves risk, and trading may not be suitable for all investors. This article is for reference only and does not constitute personal investment advice, nor does it take into account certain users’ specific investment objectives, financial situation, or other needs. Any investment decisions made based on this information are at your own risk.