












Gold prices fluctuated slightly around $4,100, awaiting the release of US CPI data.
2026-11-10 10:16:27
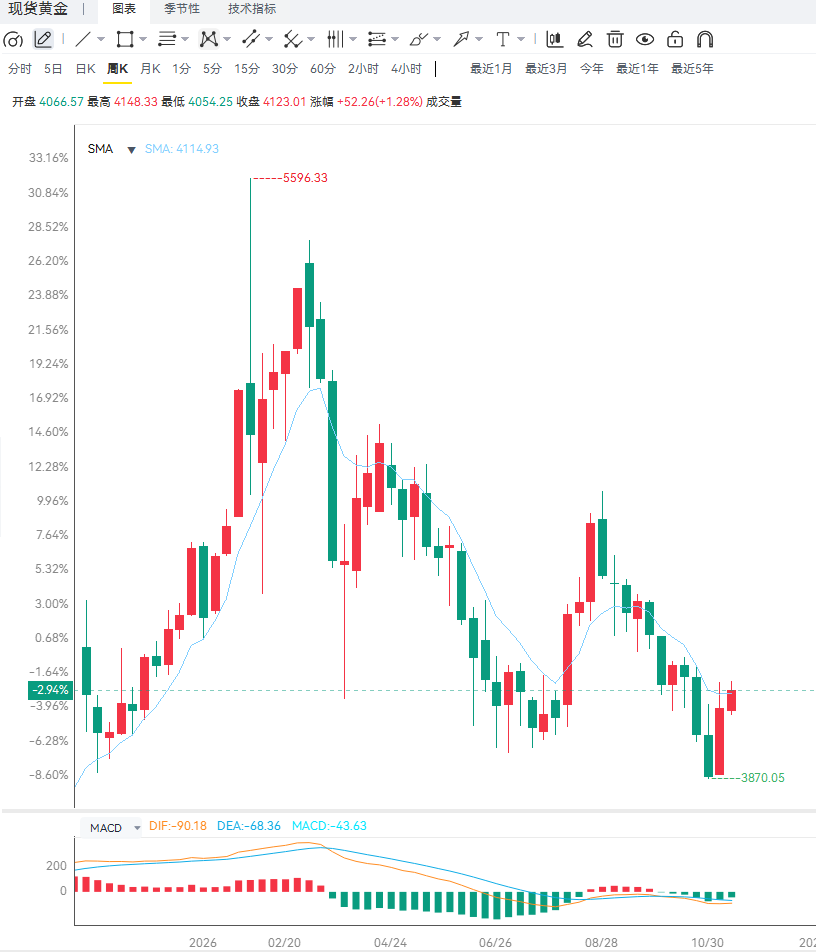
Spot gold fell back to around $4,125 in early Asian trading on Tuesday. The immediate reason for the downward pressure on gold prices was that last week's stronger-than-expected US jobs report pushed the market to further bet on interest rate hikes: according to the CME FedWatch tool, traders now see an 84.0% probability of a Fed rate hike in December, compared to 72.8% before the non-farm payroll data release. Rising interest rates increase the opportunity cost of holding gold, a non-interest-bearing asset, making gold less attractive to investors.  Last week's employment data showed that the US added 165,000 non-farm jobs in October, higher than September's 60,000 and exceeding market expectations; the unemployment rate also fell to 4.1% . This broadly strong data reinforced market expectations that the Federal Reserve would maintain high interest rates for a longer period, becoming a key macroeconomic variable suppressing precious metals. On the other hand, falling oil prices may alleviate inflation concerns, thus limiting the decline in gold. US President Trump downplayed the possibility of resuming strikes against Iran, causing oil prices to fall sharply; however, attacks on ships near the Strait of Hormuz kept supply concerns in the market's focus. Traders will closely monitor the progress of the US-Iran peace agreement for new drivers. Deutsche Bank analysts noted that credit markets on both sides of the Atlantic were "quite flat," but risk aversion in stocks led to a strong performance for gold—gold rose 5.06% last week (down 0.42% on Friday), its best weekly performance since August . The bank stated that the shift in risk appetite resulting from the sell-off in the artificial intelligence sector "helped to lower global sovereign bond yields." However, the bank also noted that the 10-year US Treasury yield rose 1 basis point to 4.87% , while Brent crude oil fell by about 1% during the same period, indicating that defensive buying of gold occurred against the backdrop of divergent trends in other major assets. Therefore, gold is currently caught in a two-way tug-of-war between "suppression from rising interest rate expectations" and "support from safe-haven demand in the stock market." The repricing of interest rates after the non-farm payrolls report creates short-term pressure, while the continued weakness in the equity market provides safe-haven buying for gold. The relative strength of these two forces will determine whether gold can hold the $4125 level. Technically, spot gold on the daily chart is still constrained below the 100-day simple moving average (around $4200) , but the price is still trading above the 20-day Bollinger Band middle line. This combination suggests that the current movement is a corrective rebound within a larger consolidation pattern. In terms of momentum, the Relative Strength Index (RSI) is around 52 , indicating only mild positive momentum, insufficient to constitute a decisive upward breakout. On the upside resistance side, initial resistance is located at the 100-day moving average around $4200, above which is the upper Bollinger Band around $4225 . The $4180-$ 4225 range forms a dense resistance zone – gold prices need to close above this cluster on the daily chart to reopen the path to higher highs. On the downside support side, initial support is provided by the middle Bollinger Band around $4065 , which, together with the psychological level of $4050, forms a key support zone of $4050-$4065. If this level is breached, the lower Bollinger Band around $3900 will be the next line of defense; a break below this level would signal a deeper correction phase, targeting previous cycle lows. On the 4-hour chart, gold prices are consolidating near $4125, with short-term momentum slowing compared to last week's strong rally, but the rebound structure remains intact. Provided the support zone of 4050-4065 holds, gold prices still have the potential to retest the resistance zone of 4180-4225. If the price breaks through this resistance zone with increased volume, the bulls may accelerate their upward momentum. Conversely, if the price falls below 4050, it will enter a deeper correction in the short term.
 Editor's Summary: The core contradiction for gold currently lies in the balance between the interest rate pressure from the "post-non-farm payrolls rate hike probability rising to 84.0%" and the safe-haven support from the "sell-off in the artificial intelligence sector triggering safe-haven demand and declining sovereign bond yields." The resistance zone of 4180-4225 and the support zone of 4050-4065 define the short-term trading boundaries. In the medium term, if subsequent inflation data such as the consumer price index continue to strengthen expectations of interest rate hikes, rising real interest rates will continue to suppress gold prices, and the 4000 level and even the lower bound of 3900 will be tested. If the equity market sell-off spreads and safe-haven funds continue to flow in, gold is expected to break through 4225 and return to trading above 4200. Key attention should be paid to the progress of the US-Iran peace agreement and the transmission of oil prices to inflation expectations, as well as the sustainability of the risk asset sell-off.
Last week's employment data showed that the US added 165,000 non-farm jobs in October, higher than September's 60,000 and exceeding market expectations; the unemployment rate also fell to 4.1% . This broadly strong data reinforced market expectations that the Federal Reserve would maintain high interest rates for a longer period, becoming a key macroeconomic variable suppressing precious metals. On the other hand, falling oil prices may alleviate inflation concerns, thus limiting the decline in gold. US President Trump downplayed the possibility of resuming strikes against Iran, causing oil prices to fall sharply; however, attacks on ships near the Strait of Hormuz kept supply concerns in the market's focus. Traders will closely monitor the progress of the US-Iran peace agreement for new drivers. Deutsche Bank analysts noted that credit markets on both sides of the Atlantic were "quite flat," but risk aversion in stocks led to a strong performance for gold—gold rose 5.06% last week (down 0.42% on Friday), its best weekly performance since August . The bank stated that the shift in risk appetite resulting from the sell-off in the artificial intelligence sector "helped to lower global sovereign bond yields." However, the bank also noted that the 10-year US Treasury yield rose 1 basis point to 4.87% , while Brent crude oil fell by about 1% during the same period, indicating that defensive buying of gold occurred against the backdrop of divergent trends in other major assets. Therefore, gold is currently caught in a two-way tug-of-war between "suppression from rising interest rate expectations" and "support from safe-haven demand in the stock market." The repricing of interest rates after the non-farm payrolls report creates short-term pressure, while the continued weakness in the equity market provides safe-haven buying for gold. The relative strength of these two forces will determine whether gold can hold the $4125 level. Technically, spot gold on the daily chart is still constrained below the 100-day simple moving average (around $4200) , but the price is still trading above the 20-day Bollinger Band middle line. This combination suggests that the current movement is a corrective rebound within a larger consolidation pattern. In terms of momentum, the Relative Strength Index (RSI) is around 52 , indicating only mild positive momentum, insufficient to constitute a decisive upward breakout. On the upside resistance side, initial resistance is located at the 100-day moving average around $4200, above which is the upper Bollinger Band around $4225 . The $4180-$ 4225 range forms a dense resistance zone – gold prices need to close above this cluster on the daily chart to reopen the path to higher highs. On the downside support side, initial support is provided by the middle Bollinger Band around $4065 , which, together with the psychological level of $4050, forms a key support zone of $4050-$4065. If this level is breached, the lower Bollinger Band around $3900 will be the next line of defense; a break below this level would signal a deeper correction phase, targeting previous cycle lows. On the 4-hour chart, gold prices are consolidating near $4125, with short-term momentum slowing compared to last week's strong rally, but the rebound structure remains intact. Provided the support zone of 4050-4065 holds, gold prices still have the potential to retest the resistance zone of 4180-4225. If the price breaks through this resistance zone with increased volume, the bulls may accelerate their upward momentum. Conversely, if the price falls below 4050, it will enter a deeper correction in the short term. Editor's Summary: The core contradiction for gold currently lies in the balance between the interest rate pressure from the "post-non-farm payrolls rate hike probability rising to 84.0%" and the safe-haven support from the "sell-off in the artificial intelligence sector triggering safe-haven demand and declining sovereign bond yields." The resistance zone of 4180-4225 and the support zone of 4050-4065 define the short-term trading boundaries. In the medium term, if subsequent inflation data such as the consumer price index continue to strengthen expectations of interest rate hikes, rising real interest rates will continue to suppress gold prices, and the 4000 level and even the lower bound of 3900 will be tested. If the equity market sell-off spreads and safe-haven funds continue to flow in, gold is expected to break through 4225 and return to trading above 4200. Key attention should be paid to the progress of the US-Iran peace agreement and the transmission of oil prices to inflation expectations, as well as the sustainability of the risk asset sell-off.
- Risk Warning and Disclaimer
- The market involves risk, and trading may not be suitable for all investors. This article is for reference only and does not constitute personal investment advice, nor does it take into account certain users’ specific investment objectives, financial situation, or other needs. Any investment decisions made based on this information are at your own risk.