













Is gold poised for a turnaround? A $3.3 billion buying spree is on the horizon!
2026-11-13 11:22:28
Societe Generale points out that the commodity index rebalancing from January 8-14 is expected to bring net buying of approximately $3.3 billion to gold (and approximately $2.5 billion to silver), providing known mechanical demand for the year-end and beginning of the new year. This could influence market sentiment and positioning. Macroeconomically, high real interest rates and expectations of further tightening by the Federal Reserve continue to weigh on gold.  The 60-minute chart for spot gold shows that prices have been falling continuously from the range high of 4448.33 near November 9th, with a cumulative drop of approximately 13%. Currently trading around 3908, it has broken below the Bollinger Middle Band at 3923.85 and is approaching the lower band at 3834.76, indicating overall weakness. The MACD lines have formed a deep death cross below the zero line, and the green bars show signs of narrowing, suggesting a slight weakening of downward momentum, but no clear reversal signal has yet appeared. Support levels to watch are the new low of 3852 and the lower Bollinger Band area, while resistance levels are the middle band and the area around 3950.
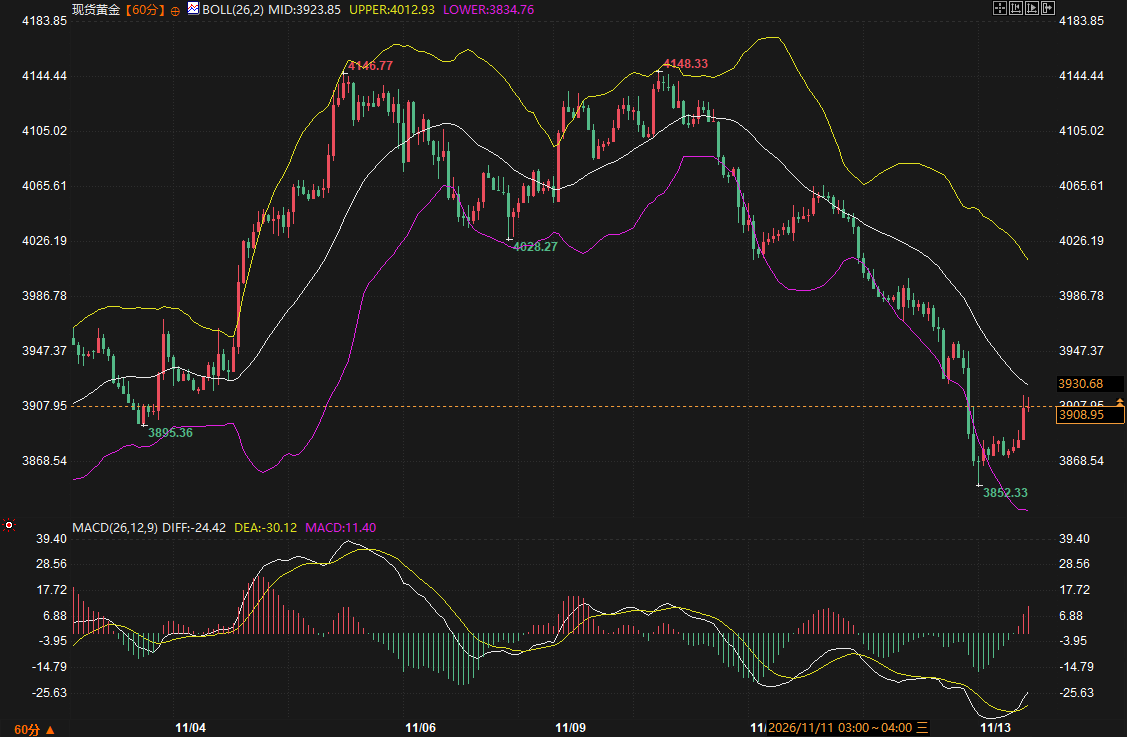
The 60-minute chart for spot gold shows that prices have been falling continuously from the range high of 4448.33 near November 9th, with a cumulative drop of approximately 13%. Currently trading around 3908, it has broken below the Bollinger Middle Band at 3923.85 and is approaching the lower band at 3834.76, indicating overall weakness. The MACD lines have formed a deep death cross below the zero line, and the green bars show signs of narrowing, suggesting a slight weakening of downward momentum, but no clear reversal signal has yet appeared. Support levels to watch are the new low of 3852 and the lower Bollinger Band area, while resistance levels are the middle band and the area around 3950.I. Technical Analysis: Weak consolidation after a surge and subsequent pullback
Starting from a low of around 3895 on November 4th, gold surged to 4146 on November 6th before falling back. It then rallied again on November 9th, reaching a new high of 4448.33, before peaking and continuing its decline. After November 11th, it entered a one-sided downward trend, breaking below 3900 and reaching a low of 3852.33. Currently, it has rebounded slightly to around 3908, showing a short-term downward trend of a rise followed by a fall. Regarding the Bollinger Bands (26,2), the middle band is at 3923.85, the upper band at 4012.93, and the lower band at 3834.76. The current price has broken below the middle band and is trading in the weak zone between the middle and lower bands, indicating that bearish forces still dominate. Discussions about changes in momentum often arise when the price approaches the lower band. The MACD (26,12,9) indicator shows DIFF at approximately -24.42, DEA at approximately -30.12, and the histogram at approximately -11.40. Both lines have formed a deep death cross below the zero axis, and the green histogram is still expanding, but there are signs of narrowing recently, indicating that the downward momentum has slightly weakened and there are low-level consolidation characteristics, but a clear reversal signal has not yet formed. Key support levels are the recent low of 3852.33 and the lower Bollinger Band around 3834, while resistance levels are the middle Bollinger Band around 3923 and the area around 3950. These levels are currently being closely watched by the market as a reference for observing whether prices will continue to be under pressure or consolidate.II. Funding: Mechanical buying during the January index rebalancing
A recent analysis by Societe Generale indicates that the annual commodity index rebalancing will take place from January 8th to 14th. Given the strong performance of the energy sector this year (driven by Middle East supply disruptions) and the relative underperformance of precious metals, funds tracking the Bloomberg Commodity Index (BCOM) and the S&P GSCI need to rebalance their weightings to target levels: selling winners and buying laggards. Accordingly, gold is expected to see net futures buying of approximately $3.3 billion, and silver approximately $2.5 billion. Gold's weighting in the BCOM is expected to increase by about 3 percentage points, and in the GSCI by about 1 percentage point. Specifically, funds are expected to sell approximately $17 billion in February gold futures while buying approximately $20.5 billion in April contracts, resulting in a net inflow of $3.3 billion. The buying volume in April contracts may exceed half of the normal daily trading volume for that contract, with a significant impact on liquidity. Currently, assets tracking the two major benchmarks total approximately $160 billion (down from a peak of over $200 billion this year). This "known known" source of demand may make some market participants more cautious about short positions before the end of the year, and may also prompt them to pay attention to relevant windows in advance. Silver, due to its smaller market size and lower liquidity, may experience more significant volatility with the same amount of inflow. Conversely, energy faces pressure to reduce positions. It is important to emphasize that this is only mechanical, short-term technical support, not a long-term shift in fundamentals. Industrial Bank maintains a 10% allocation to gold and a broader range of commodities in its multi-asset strategy, but explicitly points out that billions of dollars in rebalancing buying are insufficient to offset the continued pressure from higher real yields and expectations of further tightening by the Federal Reserve.III. Market Focus: The Interplay of Technical and Financial Window
Gold is currently in a phase of technical weakness intertwined with known mechanical buying. Technically, prices are oscillating near the lower Bollinger Band, with momentum changes attracting attention, but reversal signals remain unclear. In terms of funding, the rebalancing window from year-end to early January could be a catalyst for short-term sentiment, and the futures contract rollover process could also cause price spread fluctuations. Regarding the macro environment, market pricing in the Fed's policy path (expectations of further rate hikes and rising real interest rates) remains the core factor suppressing gold. Escalating geopolitical risks in the Middle East could temporarily impact safe-haven sentiment, but the pattern of energy benefiting more and gold under pressure this year still warrants attention. Structural demand, such as central bank gold purchases, provides a long-term backdrop, but is unlikely to dominate prices in the short term. Overall, gold is currently searching for direction between technical consolidation and the January funding window. Market participants are generally focusing on key levels and rebalancing timelines, while also monitoring the impact of subsequent economic data and policy statements on interest rate expectations.- Risk Warning and Disclaimer
- The market involves risk, and trading may not be suitable for all investors. This article is for reference only and does not constitute personal investment advice, nor does it take into account certain users’ specific investment objectives, financial situation, or other needs. Any investment decisions made based on this information are at your own risk.

