A picture: A list of "pivot points + long and short position signals" for gold, crude oil, foreign exchange and stock indices on July 29, 2025
2025-07-29 11:11:19
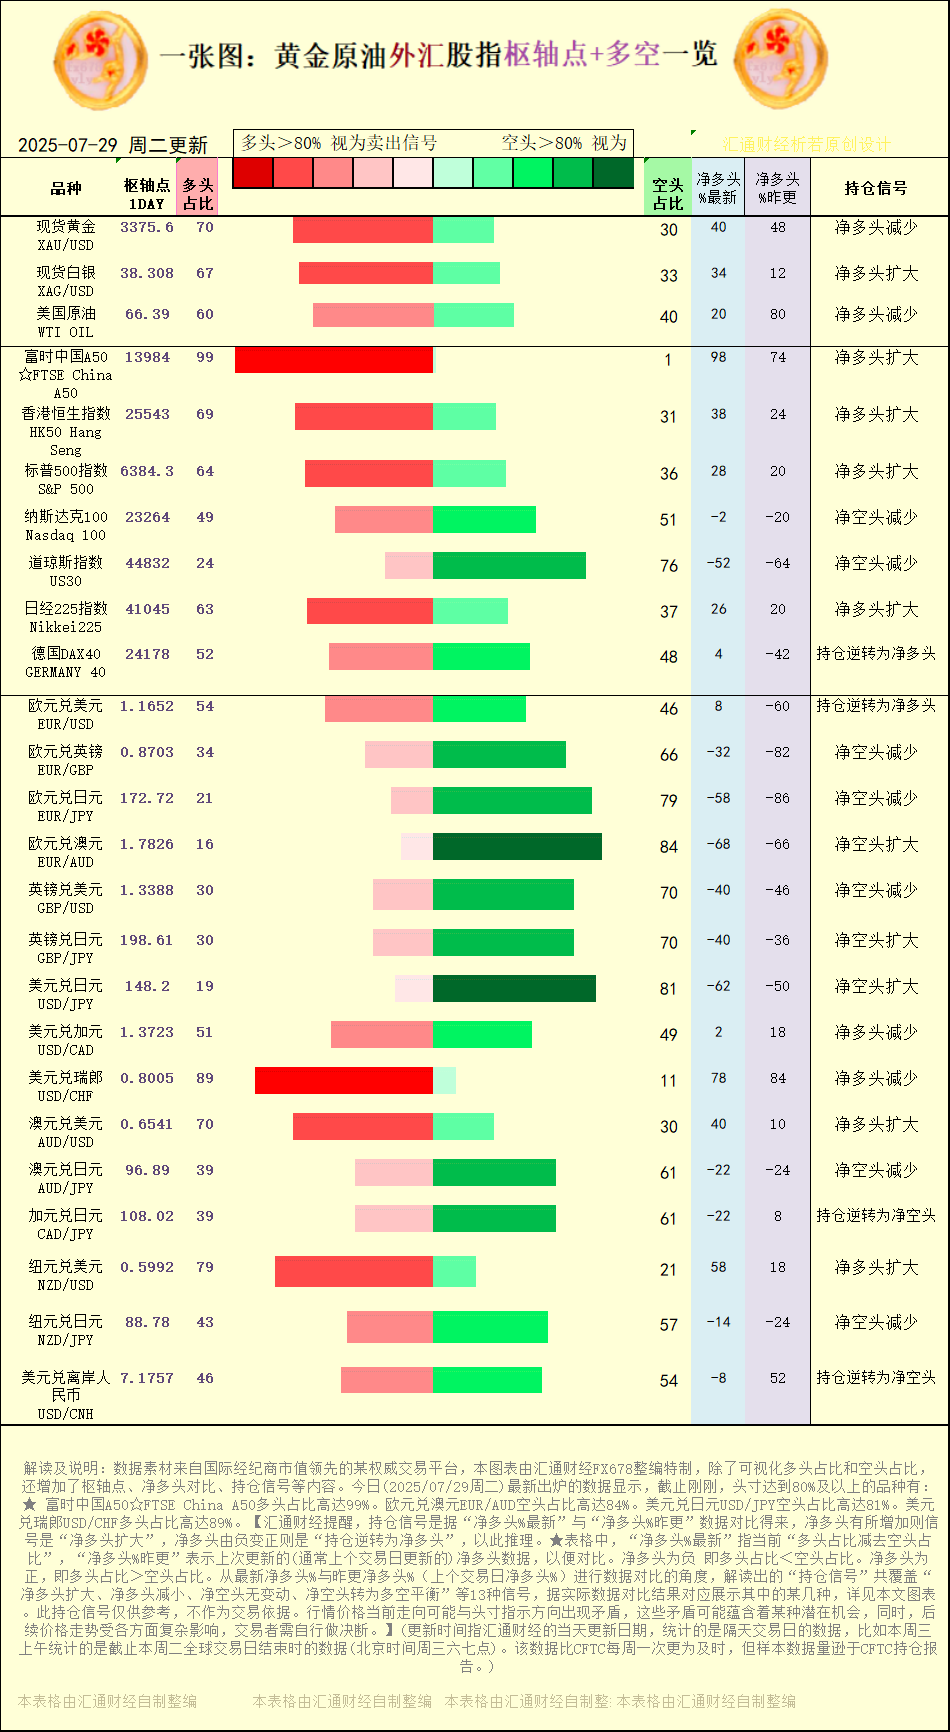
A chart: A list of "pivot points + long and short position signals" for gold, crude oil, foreign exchange and stock indices on July 29, 2025. The latest data released today (Tuesday, July 29, 2025) shows that as of just now, in this chart, there are 2 varieties that are in the "overbought" state (long positions exceed 80%), and 2 varieties that are in the "oversold" state (long positions are less than 20%). Among them, the one with the highest proportion of long positions is: FTSE China A50 ☆FTSE China A50. Spot gold XAU/USD long position accounts for 70%, US crude oil WTI OIL long position accounts for 60%, and EUR/USD long position accounts for 54%. For a more detailed list of "change signals" and a more detailed list of these varieties compared to yesterday, please see the special chart for details.
Among the signals of position changes, 7 have increased net long positions, 4 have decreased net long positions, 3 have increased net short positions, and 7 have decreased net short positions. The varieties with positions of 80% or more are: FTSE China A50☆ FTSE China A50 long positions account for up to 99%. EUR/AUD short positions account for up to 84%. USD/JPY short positions account for up to 81%. USD/CHF long positions account for up to 89%.
[Figure: Interpretation of pivot points and long and short position signals of gold, crude oil, foreign exchange and stock indices, source: Huitong Finance special chart. (Click on the image to enlarge it)]
The currencies that saw a decrease in net short positions include: Nasdaq 100, Dow Jones Index US30, EUR/GBP, EUR/JPY, GBP/USD, AUD/JPY, and NZD/JPY.
Net long positions increased in: spot silver XAG/USD, FTSE China A50☆FTSE China A50, Hong Kong Hang Seng Index HK50 Hang Seng, S&P 500, Nikkei 225, Australian dollar AUD/USD, New Zealand dollar NZD/USD. Net long positions decreased in: spot gold XAU/USD, US crude oil WTI OIL, US dollar Canadian dollar USD/CAD, US dollar Swiss franc USD/CHF.
Huitong Finance reminds that the position signal is obtained by comparing the data of "net long % latest" and "net long % yesterday". If the net long increases, the signal is "net long expansion", and if the net long changes from negative to positive, it means "position reversal to net long". In the table, "net long % latest" refers to the current "long proportion minus short proportion", and "net long % yesterday" refers to the last updated net long data (usually updated on the last trading day) for comparison. Net long is negative, which means the long proportion is less than the short proportion. Net long is positive, which means the long proportion is greater than the short proportion. From the perspective of comparing the latest net long % with the net long % yesterday (net long % on the last trading day), the interpreted "position signal" covers 13 signals including "net long expansion, net long reduction, net short unchanged, net short turning into long-short balance", etc. Some of them are displayed according to the actual data comparison results. See the chart in this article for details. This position signal is for reference only and is not used as a basis for trading. The current price trend may conflict with the position indication direction. These conflicts may contain some potential opportunities. At the same time, the subsequent price trend is affected by various complex factors, and traders need to make their own decisions.
[The trading products involved in this chart are: spot gold, spot silver, US crude oil, FTSE China A50, Hong Kong Hang Seng Index, S&P 500 Index, Nasdaq 100, Dow Jones Index, German DAX40, EUR/USD, EUR/GBP, EUR/JPY, EUR/AUD, GBP/USD, GBP/JPY, USD/JPY, USD/CAD, USD/CHF, AUD/USD, AUD/JPY, CAD/JPY, NZD/USD. ]
- Risk Warning and Disclaimer
- The market involves risk, and trading may not be suitable for all investors. This article is for reference only and does not constitute personal investment advice, nor does it take into account certain users’ specific investment objectives, financial situation, or other needs. Any investment decisions made based on this information are at your own risk.