Gold bulls strike back! Non-farm payroll figures trigger a $70 surge, and the battle for $3,400 begins next week.
2025-08-02 19:38:02
From July 28th to August 1st, the spot gold market experienced a V-shaped reversal. Driven by unexpectedly weak US non-farm payroll data and risk aversion triggered by Trump's new tariffs, gold prices rose nearly 2% on Friday, reaching a one-week high of $3,347.66 per ounce, and a weekly gain of 0.4%. The Federal Reserve kept interest rates unchanged, but weak employment data reignited expectations of a September rate cut, increasing the appeal of gold as a non-yielding asset. Meanwhile, Trump's decision to impose tariffs ranging from 10% to 41% on several countries heightened market concerns about global trade tensions, boosting safe-haven demand for gold. The following is a detailed analysis of this week's gold market trends, relevant economic data and events, analyst and institutional perspectives, and a market outlook for next week.

This week, spot gold prices experienced a period of decline followed by a surge. Early in the week, gold prices retreated under pressure due to the unexpectedly strong 3% growth in US second-quarter GDP, reaching a weekly low of $3,289.92 per ounce. On Wednesday, the Federal Reserve maintained interest rates at a range of 4.25% to 4.50%. Chairman Powell's cautious tone regarding a September rate cut further dampened market sentiment, sending gold prices into a period of low volatility. However, Friday's turning point came with the US July non-farm payroll data, which showed only 73,000 new jobs added, far below market expectations of 110,000. June's figure was revised downward to 14,000, and the unemployment rate rose to 4.2%. The weak data rekindled market bets on a September rate cut, prompting a 1.8% rise in gold prices to $3,347.66 per ounce, having surged as much as 2% in early trading, reaching its highest level since July 25. US gold futures (GCcv1) settled up 1.5% at $3,399.8 per ounce. Gold prices rose 0.4% this week, indicating a gradual recovery in bullish momentum.
1. July U.S. non-farm payroll data: The U.S. Department of Labor announced on Friday that July's job creation was 73,000, well below market expectations of 110,000. June's data was revised downward from 147,000 to 14,000, and the unemployment rate rose from 4.1% to 4.2%. The weak data heightened market concerns about an economic slowdown and fueled expectations of a September Federal Reserve rate cut. Markets are pricing in two rate cuts totaling 58 basis points by year-end.
2. Federal Reserve Interest Rate Decision: On Wednesday, the Fed maintained its target interest rate range at 4.25%-4.50%. Powell indicated he had not yet decided whether to cut rates in September, emphasizing the "solid" labor market. Weak non-farm payroll data undermined this stance, increasing market confidence in a rate cut and boosting gold, a non-yielding asset in a low-interest rate environment.
3. Trump's Tariff Policy: Trump signed an executive order on Thursday imposing tariffs ranging from 10% to 41% on countries (such as Canada, Brazil, India, and Taiwan) that fail to reach trade agreements by the August 1 deadline, triggering turmoil in global markets. Market concerns that tariffs will drive up inflation and dampen economic activity have boosted gold's safe-haven appeal.
4. Geopolitics and market sentiment: Trump’s policy statements on countries involved in the Russia-Ukraine conflict have triggered market concerns about global uncertainty, further boosting the safe-haven demand for gold.
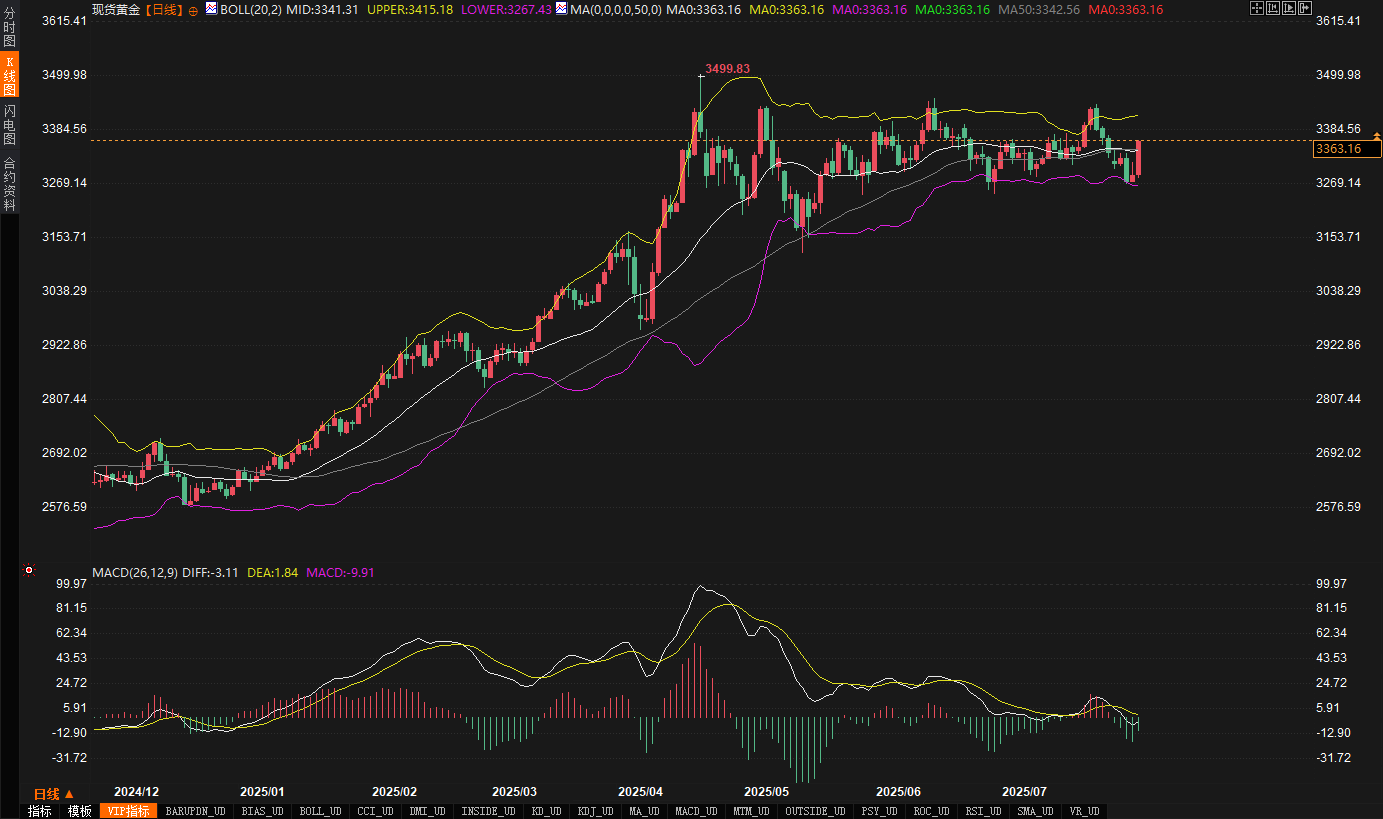
Daily Chart: Trend Continuation and New Variables. Yesterday's non-farm payroll data ignited bullish momentum, sending spot gold prices surging from $3,289.92 to $3,363.16, effectively breaking through the 50-period moving average ($3,342.56), extending this week's V-shaped reversal. The current price is above the middle Bollinger Band ($3,341.31) and near the upper Bollinger Band ($3,415.18), indicating short-term strength. However, caution is advised against profit-taking near the upper resistance level.
Bollinger Bands: The middle band and the 50-day moving average form a resonant support zone (US$3341-3342), while the upper band at US$3415.18 provides strong resistance. The Bollinger Bands are showing signs of widening, suggesting increased volatility. A break above the upper band would target the US$3450-3480 area. A pullback would place the middle band and the 50-day moving average at the intersection of the middle band and the 50-day moving average as a key defensive measure for bulls.
- MACD: DIFF (-3.11) and DEA (1.84) remain below zero, but the green bar has shortened to -9.91, indicating a weakening of bearish momentum and a potential golden cross. It remains to be seen whether DIFF can cross above DEA and stabilize at zero to confirm a daily trend reversal.
- Bart Melek (Head of Commodity Strategy at TD Securities) said that the July non-farm payroll data was lower than expected, increasing the possibility of the Federal Reserve cutting interest rates this year. Gold, as a non-yielding asset, performs well in a low-interest rate environment, and gold prices are expected to continue to rise in the short term.
Adrian Day, president of an asset management company, believes that the July non-farm payroll data, which showed only 73,000 new jobs, and the significant downward revisions to the figures for the previous two months, indicate that the job market is far from the "robust" position Powell has claimed. This undermines the Fed's rationale for maintaining high interest rates, significantly increasing the probability of a September rate cut. This, in turn, strengthens gold's appeal as a safe-haven asset. Gold prices are expected to continue their upward trend in the coming week, targeting levels above $3,400, but caution is advised regarding short-term volatility triggered by Fed officials' statements.
David Morrison, a market analyst, believes that the non-farm payroll data boosted gold prices, but a short-term breakout above $3,400 is unlikely. Gold prices need to experience a pullback and consolidation to build momentum. Daily technical indicators have reset from overbought conditions, providing room for further gains. However, a potential rebound in the US dollar index could suppress gold prices in the $3,380-3,400 range.
Chris Vecchio, head of futures strategy at a leading company, believes that Trump's tariff increases on countries like Canada (35%), India (25%), and Switzerland (39%) will weaken the dollar's dominance in global trade and boost demand for gold as an alternative currency. He predicts gold prices will test $3,450 in the coming weeks, but caution is advised against a pullback if the dollar rebounds.
Darin Newsom, a market analyst, stated that Trump's trade war policies and geopolitical tensions are providing continued buying support for gold. The December contract has entered a short-term uptrend. Combined with expectations of interest rate cuts fueled by the non-farm payroll data, gold prices are expected to challenge previous highs. He recommended monitoring Trump's subsequent trade policy pronouncements; any further toughening of the stance could further fuel risk aversion.
Marc Chandler, Managing Director of a capital markets firm, believes that the weakening dollar and falling U.S. Treasury yields triggered by the non-farm payroll data provide an opportunity for gold prices to bottom out. If gold breaks through $3,375, it will quickly test the $3,440 resistance level. Growing market confidence in a September rate cut and the possibility of another rate cut in the fourth quarter will support gold's medium- to long-term upward trend.
Next week, the gold market will be driven by multiple factors, and traders need to pay close attention to the following focuses:
1. US economic data: July's ISM non-manufacturing PMI and June's factory orders data will provide clues to economic activity. Weak data could further reinforce expectations of a Fed rate cut, pushing up gold prices. However, better-than-expected data could trigger a pullback in gold prices to the $3,341-3,342 support range.
2. Fed Policy Expectations: Public statements from Fed officials will influence market expectations regarding the path of September rate cuts. If they adopt a dovish tone, gold prices could break through the upper limit of $3,415; if they adopt a hawkish tone, a short-term correction could be triggered.
3. Trump's tariff policy: Tariffs on Canada (35%), India (25%), Taiwan (20%), and other countries will take effect next Friday, and the market will assess their impact on the global economy and inflation. If trade tensions escalate, gold's safe-haven demand may further increase; if the situation eases, gold prices may face profit-taking pressure.
4. Geopolitics and Market Sentiment: Developments related to the Russia-Ukraine conflict are likely to continue to trigger risk aversion in the market, supporting gold prices. If Trump's policy stance on the Russia-Ukraine conflict exacerbates uncertainty, gold prices could rise further.
5. Technical focus: On the daily chart, observe whether the MACD forms a golden cross and breaks through the zero axis to confirm a bullish trend; on the 4-hour chart, be wary of the top divergence signal after overbought conditions. If the price pulls back to the $3342-3311 range, consider buying on dips.
This week, the gold market experienced a V-shaped reversal, driven by weak non-farm payroll data and risk aversion triggered by Trump's tariff policies. Gold prices hit a weekly high, demonstrating strong bullish momentum. Expectations of OPEC+ production increases, trade war uncertainties, and geopolitical factors provided support for gold prices, but overbought technical indicators suggest a short-term correction. Next week, the ISM non-manufacturing PMI, statements from Federal Reserve officials, and developments in the trade situation will be key drivers of gold prices, requiring traders to remain flexible in responding to market fluctuations.
Gold market trends this week
This week, spot gold prices experienced a period of decline followed by a surge. Early in the week, gold prices retreated under pressure due to the unexpectedly strong 3% growth in US second-quarter GDP, reaching a weekly low of $3,289.92 per ounce. On Wednesday, the Federal Reserve maintained interest rates at a range of 4.25% to 4.50%. Chairman Powell's cautious tone regarding a September rate cut further dampened market sentiment, sending gold prices into a period of low volatility. However, Friday's turning point came with the US July non-farm payroll data, which showed only 73,000 new jobs added, far below market expectations of 110,000. June's figure was revised downward to 14,000, and the unemployment rate rose to 4.2%. The weak data rekindled market bets on a September rate cut, prompting a 1.8% rise in gold prices to $3,347.66 per ounce, having surged as much as 2% in early trading, reaching its highest level since July 25. US gold futures (GCcv1) settled up 1.5% at $3,399.8 per ounce. Gold prices rose 0.4% this week, indicating a gradual recovery in bullish momentum.
Economic data and events
1. July U.S. non-farm payroll data: The U.S. Department of Labor announced on Friday that July's job creation was 73,000, well below market expectations of 110,000. June's data was revised downward from 147,000 to 14,000, and the unemployment rate rose from 4.1% to 4.2%. The weak data heightened market concerns about an economic slowdown and fueled expectations of a September Federal Reserve rate cut. Markets are pricing in two rate cuts totaling 58 basis points by year-end.
2. Federal Reserve Interest Rate Decision: On Wednesday, the Fed maintained its target interest rate range at 4.25%-4.50%. Powell indicated he had not yet decided whether to cut rates in September, emphasizing the "solid" labor market. Weak non-farm payroll data undermined this stance, increasing market confidence in a rate cut and boosting gold, a non-yielding asset in a low-interest rate environment.
3. Trump's Tariff Policy: Trump signed an executive order on Thursday imposing tariffs ranging from 10% to 41% on countries (such as Canada, Brazil, India, and Taiwan) that fail to reach trade agreements by the August 1 deadline, triggering turmoil in global markets. Market concerns that tariffs will drive up inflation and dampen economic activity have boosted gold's safe-haven appeal.
4. Geopolitics and market sentiment: Trump’s policy statements on countries involved in the Russia-Ukraine conflict have triggered market concerns about global uncertainty, further boosting the safe-haven demand for gold.
Technical Analysis
Daily Chart: Trend Continuation and New Variables. Yesterday's non-farm payroll data ignited bullish momentum, sending spot gold prices surging from $3,289.92 to $3,363.16, effectively breaking through the 50-period moving average ($3,342.56), extending this week's V-shaped reversal. The current price is above the middle Bollinger Band ($3,341.31) and near the upper Bollinger Band ($3,415.18), indicating short-term strength. However, caution is advised against profit-taking near the upper resistance level.
Bollinger Bands: The middle band and the 50-day moving average form a resonant support zone (US$3341-3342), while the upper band at US$3415.18 provides strong resistance. The Bollinger Bands are showing signs of widening, suggesting increased volatility. A break above the upper band would target the US$3450-3480 area. A pullback would place the middle band and the 50-day moving average at the intersection of the middle band and the 50-day moving average as a key defensive measure for bulls.
- MACD: DIFF (-3.11) and DEA (1.84) remain below zero, but the green bar has shortened to -9.91, indicating a weakening of bearish momentum and a potential golden cross. It remains to be seen whether DIFF can cross above DEA and stabilize at zero to confirm a daily trend reversal.
Analyst and Institutional Views
- Bart Melek (Head of Commodity Strategy at TD Securities) said that the July non-farm payroll data was lower than expected, increasing the possibility of the Federal Reserve cutting interest rates this year. Gold, as a non-yielding asset, performs well in a low-interest rate environment, and gold prices are expected to continue to rise in the short term.
Adrian Day, president of an asset management company, believes that the July non-farm payroll data, which showed only 73,000 new jobs, and the significant downward revisions to the figures for the previous two months, indicate that the job market is far from the "robust" position Powell has claimed. This undermines the Fed's rationale for maintaining high interest rates, significantly increasing the probability of a September rate cut. This, in turn, strengthens gold's appeal as a safe-haven asset. Gold prices are expected to continue their upward trend in the coming week, targeting levels above $3,400, but caution is advised regarding short-term volatility triggered by Fed officials' statements.
David Morrison, a market analyst, believes that the non-farm payroll data boosted gold prices, but a short-term breakout above $3,400 is unlikely. Gold prices need to experience a pullback and consolidation to build momentum. Daily technical indicators have reset from overbought conditions, providing room for further gains. However, a potential rebound in the US dollar index could suppress gold prices in the $3,380-3,400 range.
Chris Vecchio, head of futures strategy at a leading company, believes that Trump's tariff increases on countries like Canada (35%), India (25%), and Switzerland (39%) will weaken the dollar's dominance in global trade and boost demand for gold as an alternative currency. He predicts gold prices will test $3,450 in the coming weeks, but caution is advised against a pullback if the dollar rebounds.
Darin Newsom, a market analyst, stated that Trump's trade war policies and geopolitical tensions are providing continued buying support for gold. The December contract has entered a short-term uptrend. Combined with expectations of interest rate cuts fueled by the non-farm payroll data, gold prices are expected to challenge previous highs. He recommended monitoring Trump's subsequent trade policy pronouncements; any further toughening of the stance could further fuel risk aversion.
Marc Chandler, Managing Director of a capital markets firm, believes that the weakening dollar and falling U.S. Treasury yields triggered by the non-farm payroll data provide an opportunity for gold prices to bottom out. If gold breaks through $3,375, it will quickly test the $3,440 resistance level. Growing market confidence in a September rate cut and the possibility of another rate cut in the fourth quarter will support gold's medium- to long-term upward trend.
Market outlook for next week
Next week, the gold market will be driven by multiple factors, and traders need to pay close attention to the following focuses:
1. US economic data: July's ISM non-manufacturing PMI and June's factory orders data will provide clues to economic activity. Weak data could further reinforce expectations of a Fed rate cut, pushing up gold prices. However, better-than-expected data could trigger a pullback in gold prices to the $3,341-3,342 support range.
2. Fed Policy Expectations: Public statements from Fed officials will influence market expectations regarding the path of September rate cuts. If they adopt a dovish tone, gold prices could break through the upper limit of $3,415; if they adopt a hawkish tone, a short-term correction could be triggered.
3. Trump's tariff policy: Tariffs on Canada (35%), India (25%), Taiwan (20%), and other countries will take effect next Friday, and the market will assess their impact on the global economy and inflation. If trade tensions escalate, gold's safe-haven demand may further increase; if the situation eases, gold prices may face profit-taking pressure.
4. Geopolitics and Market Sentiment: Developments related to the Russia-Ukraine conflict are likely to continue to trigger risk aversion in the market, supporting gold prices. If Trump's policy stance on the Russia-Ukraine conflict exacerbates uncertainty, gold prices could rise further.
5. Technical focus: On the daily chart, observe whether the MACD forms a golden cross and breaks through the zero axis to confirm a bullish trend; on the 4-hour chart, be wary of the top divergence signal after overbought conditions. If the price pulls back to the $3342-3311 range, consider buying on dips.
This week, the gold market experienced a V-shaped reversal, driven by weak non-farm payroll data and risk aversion triggered by Trump's tariff policies. Gold prices hit a weekly high, demonstrating strong bullish momentum. Expectations of OPEC+ production increases, trade war uncertainties, and geopolitical factors provided support for gold prices, but overbought technical indicators suggest a short-term correction. Next week, the ISM non-manufacturing PMI, statements from Federal Reserve officials, and developments in the trade situation will be key drivers of gold prices, requiring traders to remain flexible in responding to market fluctuations.
- Risk Warning and Disclaimer
- The market involves risk, and trading may not be suitable for all investors. This article is for reference only and does not constitute personal investment advice, nor does it take into account certain users’ specific investment objectives, financial situation, or other needs. Any investment decisions made based on this information are at your own risk.