Technical analysis: Can gold prices continue to rise?
2025-08-05 17:42:59
Gold prices formed a bottom above $3,325 and began a new upward trend. The bulls gained strength and successfully pushed the price above the $3,350 resistance level.

The 4-hour chart of spot gold shows that the price is stable above the $3,350 level, the 100-period simple moving average, and the 200-period simple moving average. The price fell below the 61.8% Fibonacci retracement level of the decline from the $3,438 high to $3,268 low.
On the upside, an immediate resistance is near the $3,400 level. This level is close to the 76.4% Fibonacci retracement level of the decline from the $3,438 high to $3,268 low.
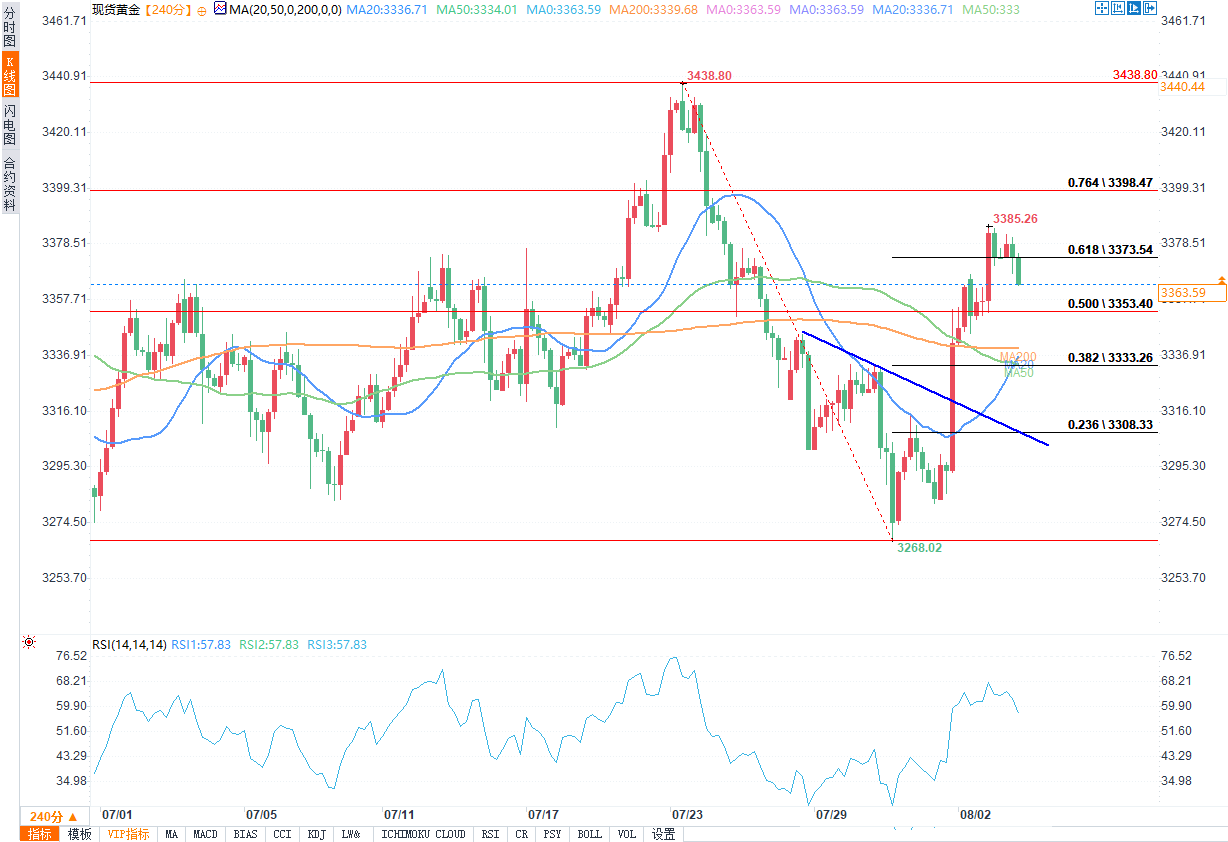
(Source of spot gold 4-hour chart: Yihuitong)
The next major resistance level is around $3,420. A further resistance level could be $3,432. A clear break above $3,432 could open the door for further gains. The next major resistance level could be $3,440. A break above this level could push the price towards the key $3,450 level.
On the downside, initial support is around $3,365. The first key support is $3,350. The next major support is around $3,340. The current major support is $3,315.
A break below the $3,315 support level could trigger more declines. The next major support is near the $3,300 level.
Looking at WTI crude oil, the price is showing many bearish signs and may fall further below the $66.00 support level.
At 17:38 Beijing time, spot gold was quoted at US$3,363.28 per ounce, down 0.30%.
The 4-hour chart of spot gold shows that the price is stable above the $3,350 level, the 100-period simple moving average, and the 200-period simple moving average. The price fell below the 61.8% Fibonacci retracement level of the decline from the $3,438 high to $3,268 low.
On the upside, an immediate resistance is near the $3,400 level. This level is close to the 76.4% Fibonacci retracement level of the decline from the $3,438 high to $3,268 low.
(Source of spot gold 4-hour chart: Yihuitong)
The next major resistance level is around $3,420. A further resistance level could be $3,432. A clear break above $3,432 could open the door for further gains. The next major resistance level could be $3,440. A break above this level could push the price towards the key $3,450 level.
On the downside, initial support is around $3,365. The first key support is $3,350. The next major support is around $3,340. The current major support is $3,315.
A break below the $3,315 support level could trigger more declines. The next major support is near the $3,300 level.
Looking at WTI crude oil, the price is showing many bearish signs and may fall further below the $66.00 support level.
At 17:38 Beijing time, spot gold was quoted at US$3,363.28 per ounce, down 0.30%.
- Risk Warning and Disclaimer
- The market involves risk, and trading may not be suitable for all investors. This article is for reference only and does not constitute personal investment advice, nor does it take into account certain users’ specific investment objectives, financial situation, or other needs. Any investment decisions made based on this information are at your own risk.