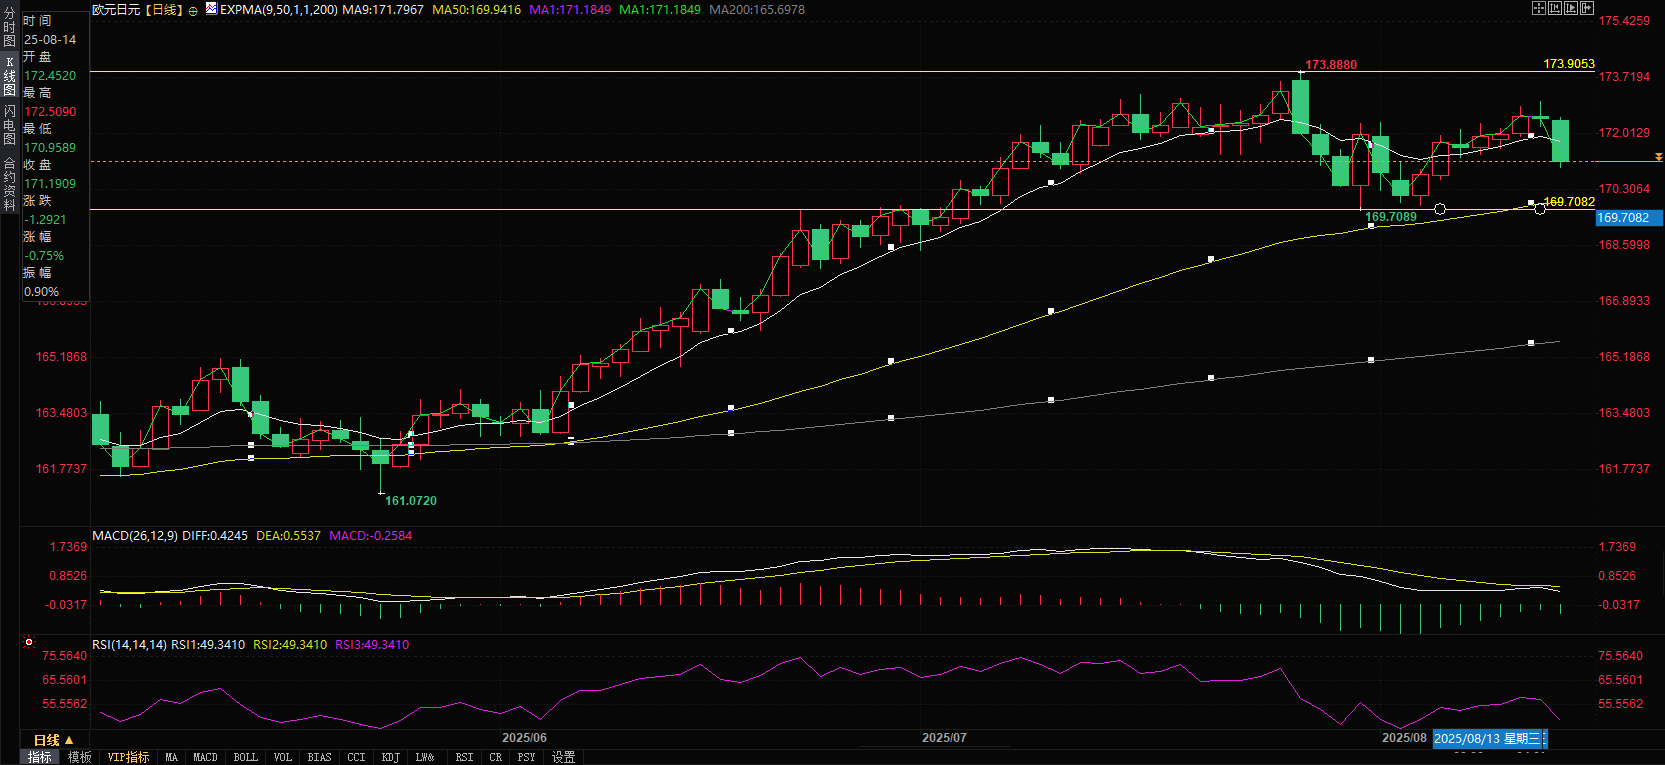
Euro/yen: Bulls and bears battle at 171.8! A technical "false breakout" signals a move to 174. Is it within reach?
2025-08-14 17:54:42

False breakout reversal signal
The 14-day Relative Strength Index (RSI) fell below its 50-day moving average, sending a bearish signal. Furthermore, as EUR/JPY has fallen below its 9-day exponential moving average (EMA), short-term price momentum has weakened further.
On the downside, the exchange rate may fall to the 50-day moving average of 169.97 and then test the six-week low of 169.72 set on July 31. If it breaks below this level, it may further fall to the two-month low of 168.46 recorded on July 1.
The EUR/JPY pair may first test the near-term resistance of its 9-day exponential moving average (EMA) at 171.81. A break above this level would strengthen short-term price momentum and propel the exchange rate back into the rising channel—signifying both the completion of a false breakout pattern and the resumption of the upward trend. Further gains could push the exchange rate towards 173.90, reached on July 28, 2025 (the highest point since July 2024), and then towards the upper limit of the rising channel near 174.30.

In-depth technical analysis
The EUR/JPY pair is currently at a critical turning point, with bulls and bears engaged in a fierce battle in the 171.00-171.80 range. On a weekly basis, the exchange rate remains above the long-term uptrend line established in May 2024, but the daily pullback has reached the lower Bollinger Band (currently at 170.85). Of note, the momentum indicator MACD formed a death cross below the zero axis, and the fast and slow lines continue to widen, indicating growing bearish momentum. However, if the exchange rate finds support in the 170.50-170.80 area, it will form the right shoulder of a head and shoulders bottom pattern. This, combined with a bottoming divergence signal from the RSI, could trigger a technical rebound. Traders should pay close attention to tomorrow's Eurozone preliminary GDP figures, which will be released. If they exceed expectations, they could be a catalyst to reverse the current downtrend.
At 17:45 Beijing time, the euro was trading at 171.20 against the US dollar.
- Risk Warning and Disclaimer
- The market involves risk, and trading may not be suitable for all investors. This article is for reference only and does not constitute personal investment advice, nor does it take into account certain users’ specific investment objectives, financial situation, or other needs. Any investment decisions made based on this information are at your own risk.


