Technical Analysis: USD/JPY hits resistance again, can the key support level hold?
2025-09-13 00:44:52
During the U.S. trading session on Friday (September 12), the USD/JPY pair showed an overall volatile upward trend, gradually climbing from a low level. There were certain fluctuations during the period, but the upward trend was more obvious.

USD/JPY failed to break through the 148.20 level on a sustained basis and subsequently experienced a downside correction. The 4-hour chart shows that a key bearish trend line is forming with resistance at 148.00.
USD/JPY attempted to break through the 148.00 mark to start a new round of upward movement. However, the pair encountered resistance around 148.00 and fell back, giving up some of the gains.
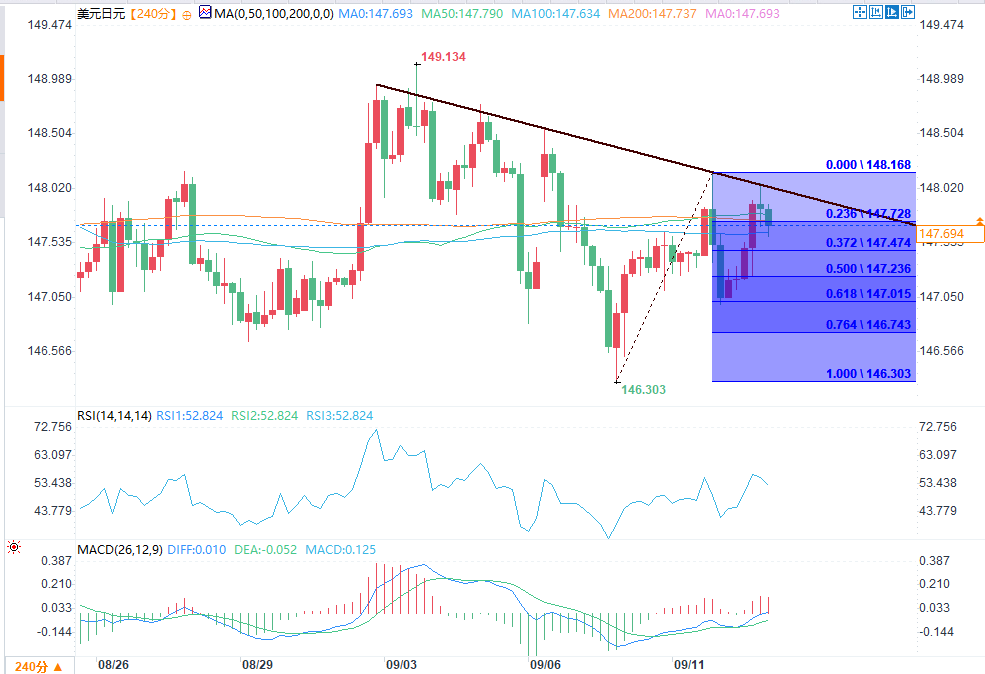
(Source: 4-hour USD/JPY chart)
Looking at the 4-hour chart, USD/JPY is facing selling pressure, breaking below the 148.00 level and further dipping below the 50% Fibonacci retracement level of the upward move from the 146.30 low to the 148.16 high. Currently, USD/JPY has fallen back below both the 100-period moving average and the 200-period moving average on the 4-hour chart.
Downside: Immediate support is at 147.00. The next key area of interest could be around the 76.4% Fibonacci retracement level, at 146.75. If the decline continues, the pair could fall further to 146.20.
On the upside, USD/JPY may face resistance near 148.00, where a key bearish trend line has formed. The first major resistance for bulls is 148.20, and a close above this level could set the stage for a new uptrend.
If it breaks above 148.20, USD/JPY is expected to attack 148.50; if it further breaks through 148.50, bulls may target 149.20; if the upward trend continues, it may even test the 150.00 mark.
At 00:37 Beijing time, the USD/JPY exchange rate was 147.742/751, up 0.37%.
USD/JPY failed to break through the 148.20 level on a sustained basis and subsequently experienced a downside correction. The 4-hour chart shows that a key bearish trend line is forming with resistance at 148.00.
USD/JPY attempted to break through the 148.00 mark to start a new round of upward movement. However, the pair encountered resistance around 148.00 and fell back, giving up some of the gains.
(Source: 4-hour USD/JPY chart)
Looking at the 4-hour chart, USD/JPY is facing selling pressure, breaking below the 148.00 level and further dipping below the 50% Fibonacci retracement level of the upward move from the 146.30 low to the 148.16 high. Currently, USD/JPY has fallen back below both the 100-period moving average and the 200-period moving average on the 4-hour chart.
Downside: Immediate support is at 147.00. The next key area of interest could be around the 76.4% Fibonacci retracement level, at 146.75. If the decline continues, the pair could fall further to 146.20.
On the upside, USD/JPY may face resistance near 148.00, where a key bearish trend line has formed. The first major resistance for bulls is 148.20, and a close above this level could set the stage for a new uptrend.
If it breaks above 148.20, USD/JPY is expected to attack 148.50; if it further breaks through 148.50, bulls may target 149.20; if the upward trend continues, it may even test the 150.00 mark.
At 00:37 Beijing time, the USD/JPY exchange rate was 147.742/751, up 0.37%.
- Risk Warning and Disclaimer
- The market involves risk, and trading may not be suitable for all investors. This article is for reference only and does not constitute personal investment advice, nor does it take into account certain users’ specific investment objectives, financial situation, or other needs. Any investment decisions made based on this information are at your own risk.