The US dollar and US Treasury bonds have both broken through their support levels. What is the market waiting for? The Federal Reserve is about to trigger a market reversal on Wednesday!
2025-09-16 19:32:32
On Tuesday (September 16th, Beijing time), the U.S. Treasury market exhibited a cautious consolidation pattern ahead of the Federal Reserve's policy meeting. The 10-year Treasury yield edged down slightly to 4.036%, a 0.05% drop on the day, reflecting investors' preemptive pricing of easing signals. Meanwhile, the U.S. dollar index continued its recent weakness, slipping to 97.0189 on the 240-minute chart, down 0.33% on the day and breaking below a key technical level, highlighting the gradual dominance of bearish forces. This round of adjustments is not isolated, but is closely intertwined with global liquidity expectations, particularly the market consensus of a 25 basis point interest rate cut at the Federal Reserve's meeting this Wednesday, which is quietly reshaping the logical chain of the bond-exchange rate linkage. The combination of recent weak employment data and benign inflation indicators further reinforces this expectation, but also injects uncertainty into the dollar. If the policy shift is perceived as a concession to external pressure, short-term volatility may intensify.

From a broader perspective, the slight decline in US Treasury yields isn't a sudden event, but rather a continuation of the downward trend that began last Friday, when the benchmark 10-year yield retreated from 4.058% to 4.041%. Coupled with the unexpectedly negative New York Fed manufacturing survey, funds in the bond market began to flow back into long-term assets. Investors are increasing the duration of their portfolios to capture the potential benefits of falling interest rates, as evidenced by the increase in the weighted average maturity of money market funds: over the past month, the maturity of government funds has increased to an average of 40 days, while that of prime funds has risen to 29 days. This positioning directly points to expectations of a dovish shift by the Federal Reserve, particularly given the unemployment rate's rise to 4.3% in August and job growth far below expectations. The US dollar index, under pressure from these bond market signals, suffered its biggest weekly drop since early August, falling over 2%. A Bloomberg survey median suggests the probability of two rate cuts this year has exceeded expectations, with some economists even betting on three or more. This isn't just data-driven; it represents the market's interpretation of the Fed's shift in its "reaction function" from inflation-driven to labor-protection-focused.
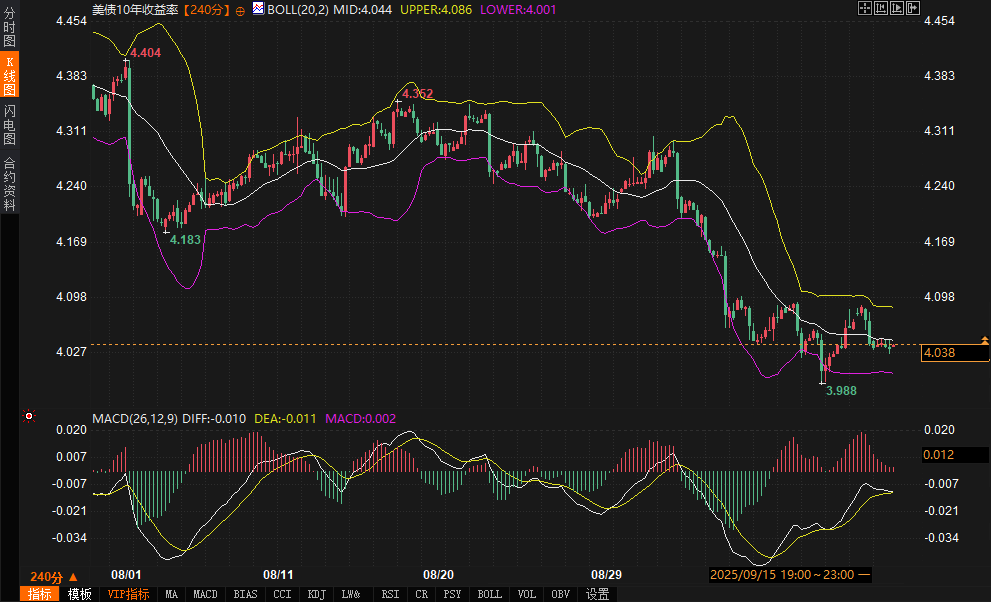
The 240-minute chart of the 10-year US Treasury yield provides a clear window into the market's current wait-and-see stance. The price is stable at 4.036%, trading below the middle Bollinger Band at 4.044, but not yet reaching the lower Bollinger Band at 4.001. This creates a narrow trading range with limited volatility, suggesting a temporary balance of forces between bulls and bears. The MACD indicator further confirms this: the DIFF line is at -0.010, slightly below the DEA line of -0.011, and the histogram is close to the zero axis and slightly green. While bearish momentum exists, it is insufficient to force a breakout. The overall pattern resembles a volatile market rather than a clear trend.
This technical stalemate is closely tied to the lack of fundamental catalysts. Changes in US Treasury yields are inherently anchored to inflation expectations and the Fed's interest rate path. While recent producer price inflation has been relatively mild, the consumer price index has risen more than expected, leaving the market awaiting the latest economic projections and dot plot from the FOMC meeting on Wednesday to confirm the magnitude and pace of rate cuts. The head of a prominent institution's fixed income team noted that if the Fed shifts from its current target range of 4.25%-4.50% to a more dovish path—for example, a cumulative 100 basis point rate cut over the next three meetings—the entire yield curve would shift downward, significantly boosting the return potential of long-dated bonds. This aligns with the current market trend of extending duration: Over the past six weeks, an increase in holdings of five- to 10-year bonds has become prevalent, with clients' long-dated positions rising to 30%, a new high since early August.
Judging from immediate feedback, the trading community's interpretation of this volatile pattern is converging. One macroeconomic observer emphasized that the decline in US Treasury yields is amplifying exchange rate volatility in emerging markets, but it also creates arbitrage opportunities for bond investors, especially amid a structural shift in the easing cycle. Another strategist warned that if Powell emphasizes uncertainty in his press conference, the yield curve could steepen further, with the short end falling and the long end weighed down by fiscal deficit concerns. This view is not groundless, as it is based on the widening of the 5-year/30-year yield spread to a record high of 126 basis points on September 5th. Although it narrowed to 104.8 basis points on Monday, opportunities to re-establish positions remain a key focus. Overall, the technical range of US Treasury bonds between 4.001 and 4.044 has become a key intraday target. If the lower support level holds, rebound momentum may be revitalized; conversely, a break below this level would open up room for further declines, testing the market's resilience to easing expectations.
This neutral technical signal also reflects the bond market's sensitivity to global risk aversion. The European benchmark yield edged up to 2.71%, with German investor confidence unexpectedly rebounding. However, overall capital remained on the sidelines, awaiting the Fed's communication tone. The correlation between currencies like the Australian dollar and British pound against US Treasuries is transmitting pressure through yield differentials, reinforcing the dollar's relative weakness.
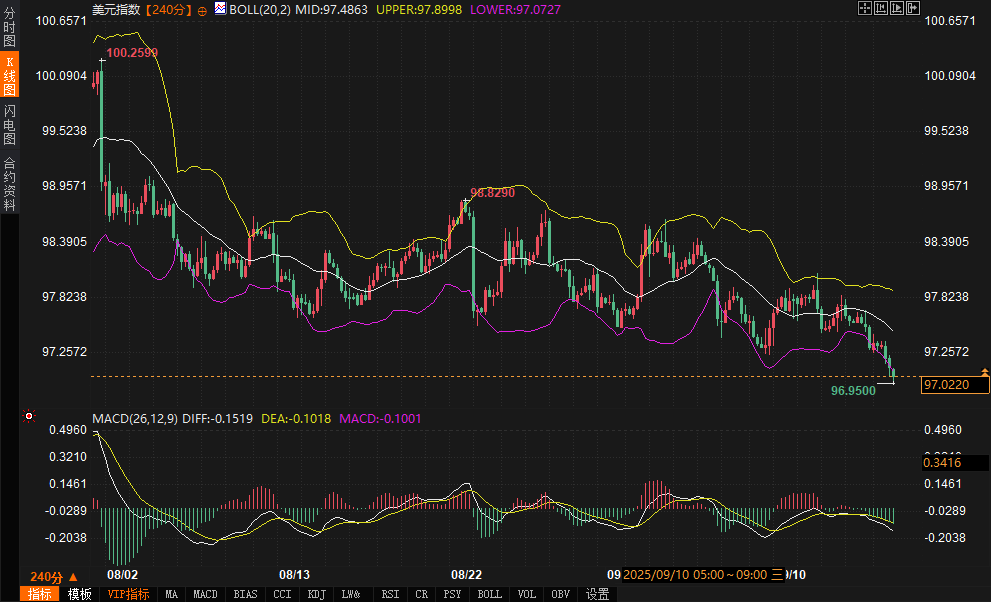
The US Dollar Index (USD) shows even more weakness on its 240-minute chart. The price at 97.0189 has fallen below both the middle Bollinger Band at 97.4861 and the lower Bollinger Band at 97.0724, forming a clear downward trend. Resistance at the previous high of 97.9409 is far away, while support at the previous low of 96.9500 is within easy reach, giving the bearish momentum the upper hand. The MACD indicator's DIFF line has crossed below the DEA line and remains below zero. The histogram is showing strong green volume, clearly confirming increased selling pressure and suggesting a further test of support.
From the perspective of US Treasuries, this decline in the US dollar isn't simply a technical correction, but rather a spillover effect of the yield curve adjustment. Expectations of a Fed rate cut are weakening the dollar's appeal by lengthening the duration of long-term bonds: when interest rates fall, long-term bond prices rise more, and the logic of capital outflow from US dollar assets to other safe-haven or risky assets becomes increasingly clear. Leading research strategists have observed a general market shift toward buying bonds to preempt post-rate cut returns, which has directly depressed the valuation center of the US dollar index. A report shared by a forex trader suggests that the Fed's initiation of a rate cut cycle will adjust portfolio views on commodities, with the US dollar facing a medium-term downside risk of 4%-5%. This echoes a recent JPMorgan Chase survey, which indicates that optimistic allocations to emerging market and mining stocks are driven by expectations of a weaker US dollar.
Converging fundamentals further reinforce this transmission path. The combination of an August unemployment rate of 4.3% and well-below-expected job growth has already pushed labor market conditions beyond the Fed's expectations at the beginning of the year, while muted inflation suggests room for a policy shift. Market concerns sparked by tariff rhetoric are amplifying risk aversion and driving capital flows back into long-term US Treasuries, which in turn is exacerbating pressure on the US dollar. Jefferies strategists emphasize that Powell's tone will be crucial: if he emphasizes inflation risks or economic uncertainty, rate cut expectations could be lowered, potentially providing a respite for the US dollar. However, current pricing in a 25 basis point adjustment increases the probability of short-term dominance. Another firm's view is that if the rate cut is interpreted as a concession to political pressure, US dollar assets will face new risks. This aligns with the Chief Global Strategist's warning that the linkage between the stock, bond, and US dollar markets will quickly become apparent after the meeting.
The intersection of technical and fundamental factors has brought the US dollar's support range of 96.9500-97.0724 into focus. If the price stabilizes here, a rebound could test the mid-range; however, a break below this level would open up further downside potential, with a widening bond-exchange rate differential acting as a catalyst. Compared to historical market trends, such as the dollar's brutal decline in the first half of the year, the current correction is more timely, stemming from the Fed's clear shift in course.
This Wednesday's FOMC meeting will be a watershed moment for bond and foreign exchange markets. The market has fully priced in a 25 basis point rate cut, lowering the target range to 4.00%-4.25%, ending nine months of stabilization. However, the updated dot plot and Powell's communication will determine the long-term impact of the easing: the June median suggests a 50 basis point rate cut this year, with 25 basis points in each of 2026-2027. A more aggressive rate cut would validate bond market duration strategies and risk a deeper correction for the US dollar.
Traders' focus on this correlation is on the yield curve steepening trade: buying the short end and selling 30-year bonds, driven by fiscal deficit concerns and expectations of rate cuts. One portfolio manager noted that if tariff talk prompts the Fed to pause its easing, the curve steepening will intensify, potentially pushing up long-term Treasury yields, which would provide limited support for the dollar. Another view emphasizes that if long-term rates remain high after a rate cut, the easing effect will fizzle out, and the dollar's structural weakness will persist.
The slight rise in European bond markets also provides a contrast to US Treasuries: Germany's 10-year yield rose 1.5 basis points to 2.71%, and the ECB's easing pricing through the end of 2026 is only 145 basis points. This temporarily maintains the relative appeal of US Treasuries, but the Fed's dovish tone could reverse this trend. Retail sales data will be released later; if it continues to weaken, it will further lock in the dollar's downward trajectory.
Looking ahead to the next week, US Treasury yields are expected to continue fluctuating within the 4.001-4.086 range. However, if the meeting confirms a dovish approach, a hold of the lower support level will trigger a rebound, and the release of long-term duration dividends may push the yield center down to around 4.00%. The US dollar index faces a more obvious short-term test, and the reaction to the previous low of 96.9500 will be crucial. If it falls, a retracement towards the 97.00 mark will begin. Combined with the transmission of bond market capital outflows, the index may test the deeper range of 96.50.
The core of this outlook stems from the reshaping of liquidity from the perspective of US Treasuries: the expectation of rate cuts will exacerbate the price sensitivity of long-term bonds, further weakening the US dollar's role as a funding currency, particularly amidst rising global risk aversion. Strategists agree that the dollar has room to fall by 4%-5% in the short term, but caution is warranted regarding Powell's emphasis on uncertainty. If the dot plot is adjusted downwards to a more conservative tone, a narrowing of the bond-exchange rate differential could provide respite. Overall, the easing-led bond market will likely lead to continued US dollar weakness. Traders should closely monitor the immediate reaction after the meeting to capitalize on any secondary opportunities arising from this.
From a broader perspective, the slight decline in US Treasury yields isn't a sudden event, but rather a continuation of the downward trend that began last Friday, when the benchmark 10-year yield retreated from 4.058% to 4.041%. Coupled with the unexpectedly negative New York Fed manufacturing survey, funds in the bond market began to flow back into long-term assets. Investors are increasing the duration of their portfolios to capture the potential benefits of falling interest rates, as evidenced by the increase in the weighted average maturity of money market funds: over the past month, the maturity of government funds has increased to an average of 40 days, while that of prime funds has risen to 29 days. This positioning directly points to expectations of a dovish shift by the Federal Reserve, particularly given the unemployment rate's rise to 4.3% in August and job growth far below expectations. The US dollar index, under pressure from these bond market signals, suffered its biggest weekly drop since early August, falling over 2%. A Bloomberg survey median suggests the probability of two rate cuts this year has exceeded expectations, with some economists even betting on three or more. This isn't just data-driven; it represents the market's interpretation of the Fed's shift in its "reaction function" from inflation-driven to labor-protection-focused.
Technical consolidation of U.S. Treasury yields: accumulating momentum amid volatility
The 240-minute chart of the 10-year US Treasury yield provides a clear window into the market's current wait-and-see stance. The price is stable at 4.036%, trading below the middle Bollinger Band at 4.044, but not yet reaching the lower Bollinger Band at 4.001. This creates a narrow trading range with limited volatility, suggesting a temporary balance of forces between bulls and bears. The MACD indicator further confirms this: the DIFF line is at -0.010, slightly below the DEA line of -0.011, and the histogram is close to the zero axis and slightly green. While bearish momentum exists, it is insufficient to force a breakout. The overall pattern resembles a volatile market rather than a clear trend.
This technical stalemate is closely tied to the lack of fundamental catalysts. Changes in US Treasury yields are inherently anchored to inflation expectations and the Fed's interest rate path. While recent producer price inflation has been relatively mild, the consumer price index has risen more than expected, leaving the market awaiting the latest economic projections and dot plot from the FOMC meeting on Wednesday to confirm the magnitude and pace of rate cuts. The head of a prominent institution's fixed income team noted that if the Fed shifts from its current target range of 4.25%-4.50% to a more dovish path—for example, a cumulative 100 basis point rate cut over the next three meetings—the entire yield curve would shift downward, significantly boosting the return potential of long-dated bonds. This aligns with the current market trend of extending duration: Over the past six weeks, an increase in holdings of five- to 10-year bonds has become prevalent, with clients' long-dated positions rising to 30%, a new high since early August.
Judging from immediate feedback, the trading community's interpretation of this volatile pattern is converging. One macroeconomic observer emphasized that the decline in US Treasury yields is amplifying exchange rate volatility in emerging markets, but it also creates arbitrage opportunities for bond investors, especially amid a structural shift in the easing cycle. Another strategist warned that if Powell emphasizes uncertainty in his press conference, the yield curve could steepen further, with the short end falling and the long end weighed down by fiscal deficit concerns. This view is not groundless, as it is based on the widening of the 5-year/30-year yield spread to a record high of 126 basis points on September 5th. Although it narrowed to 104.8 basis points on Monday, opportunities to re-establish positions remain a key focus. Overall, the technical range of US Treasury bonds between 4.001 and 4.044 has become a key intraday target. If the lower support level holds, rebound momentum may be revitalized; conversely, a break below this level would open up room for further declines, testing the market's resilience to easing expectations.
This neutral technical signal also reflects the bond market's sensitivity to global risk aversion. The European benchmark yield edged up to 2.71%, with German investor confidence unexpectedly rebounding. However, overall capital remained on the sidelines, awaiting the Fed's communication tone. The correlation between currencies like the Australian dollar and British pound against US Treasuries is transmitting pressure through yield differentials, reinforcing the dollar's relative weakness.
Short position confirmation of the US dollar index: pressure transmission from the perspective of US bonds
The US Dollar Index (USD) shows even more weakness on its 240-minute chart. The price at 97.0189 has fallen below both the middle Bollinger Band at 97.4861 and the lower Bollinger Band at 97.0724, forming a clear downward trend. Resistance at the previous high of 97.9409 is far away, while support at the previous low of 96.9500 is within easy reach, giving the bearish momentum the upper hand. The MACD indicator's DIFF line has crossed below the DEA line and remains below zero. The histogram is showing strong green volume, clearly confirming increased selling pressure and suggesting a further test of support.
From the perspective of US Treasuries, this decline in the US dollar isn't simply a technical correction, but rather a spillover effect of the yield curve adjustment. Expectations of a Fed rate cut are weakening the dollar's appeal by lengthening the duration of long-term bonds: when interest rates fall, long-term bond prices rise more, and the logic of capital outflow from US dollar assets to other safe-haven or risky assets becomes increasingly clear. Leading research strategists have observed a general market shift toward buying bonds to preempt post-rate cut returns, which has directly depressed the valuation center of the US dollar index. A report shared by a forex trader suggests that the Fed's initiation of a rate cut cycle will adjust portfolio views on commodities, with the US dollar facing a medium-term downside risk of 4%-5%. This echoes a recent JPMorgan Chase survey, which indicates that optimistic allocations to emerging market and mining stocks are driven by expectations of a weaker US dollar.
Converging fundamentals further reinforce this transmission path. The combination of an August unemployment rate of 4.3% and well-below-expected job growth has already pushed labor market conditions beyond the Fed's expectations at the beginning of the year, while muted inflation suggests room for a policy shift. Market concerns sparked by tariff rhetoric are amplifying risk aversion and driving capital flows back into long-term US Treasuries, which in turn is exacerbating pressure on the US dollar. Jefferies strategists emphasize that Powell's tone will be crucial: if he emphasizes inflation risks or economic uncertainty, rate cut expectations could be lowered, potentially providing a respite for the US dollar. However, current pricing in a 25 basis point adjustment increases the probability of short-term dominance. Another firm's view is that if the rate cut is interpreted as a concession to political pressure, US dollar assets will face new risks. This aligns with the Chief Global Strategist's warning that the linkage between the stock, bond, and US dollar markets will quickly become apparent after the meeting.
The intersection of technical and fundamental factors has brought the US dollar's support range of 96.9500-97.0724 into focus. If the price stabilizes here, a rebound could test the mid-range; however, a break below this level would open up further downside potential, with a widening bond-exchange rate differential acting as a catalyst. Compared to historical market trends, such as the dollar's brutal decline in the first half of the year, the current correction is more timely, stemming from the Fed's clear shift in course.
Fed meeting preview: potential variables in the bond-exchange rate linkage
This Wednesday's FOMC meeting will be a watershed moment for bond and foreign exchange markets. The market has fully priced in a 25 basis point rate cut, lowering the target range to 4.00%-4.25%, ending nine months of stabilization. However, the updated dot plot and Powell's communication will determine the long-term impact of the easing: the June median suggests a 50 basis point rate cut this year, with 25 basis points in each of 2026-2027. A more aggressive rate cut would validate bond market duration strategies and risk a deeper correction for the US dollar.
Traders' focus on this correlation is on the yield curve steepening trade: buying the short end and selling 30-year bonds, driven by fiscal deficit concerns and expectations of rate cuts. One portfolio manager noted that if tariff talk prompts the Fed to pause its easing, the curve steepening will intensify, potentially pushing up long-term Treasury yields, which would provide limited support for the dollar. Another view emphasizes that if long-term rates remain high after a rate cut, the easing effect will fizzle out, and the dollar's structural weakness will persist.
The slight rise in European bond markets also provides a contrast to US Treasuries: Germany's 10-year yield rose 1.5 basis points to 2.71%, and the ECB's easing pricing through the end of 2026 is only 145 basis points. This temporarily maintains the relative appeal of US Treasuries, but the Fed's dovish tone could reverse this trend. Retail sales data will be released later; if it continues to weaken, it will further lock in the dollar's downward trajectory.
Outlook: The dollar continues to decline under the leadership of the loose bond market
Looking ahead to the next week, US Treasury yields are expected to continue fluctuating within the 4.001-4.086 range. However, if the meeting confirms a dovish approach, a hold of the lower support level will trigger a rebound, and the release of long-term duration dividends may push the yield center down to around 4.00%. The US dollar index faces a more obvious short-term test, and the reaction to the previous low of 96.9500 will be crucial. If it falls, a retracement towards the 97.00 mark will begin. Combined with the transmission of bond market capital outflows, the index may test the deeper range of 96.50.
The core of this outlook stems from the reshaping of liquidity from the perspective of US Treasuries: the expectation of rate cuts will exacerbate the price sensitivity of long-term bonds, further weakening the US dollar's role as a funding currency, particularly amidst rising global risk aversion. Strategists agree that the dollar has room to fall by 4%-5% in the short term, but caution is warranted regarding Powell's emphasis on uncertainty. If the dot plot is adjusted downwards to a more conservative tone, a narrowing of the bond-exchange rate differential could provide respite. Overall, the easing-led bond market will likely lead to continued US dollar weakness. Traders should closely monitor the immediate reaction after the meeting to capitalize on any secondary opportunities arising from this.
- Risk Warning and Disclaimer
- The market involves risk, and trading may not be suitable for all investors. This article is for reference only and does not constitute personal investment advice, nor does it take into account certain users’ specific investment objectives, financial situation, or other needs. Any investment decisions made based on this information are at your own risk.