Technical Analysis: AUD/USD rises on strong CPI data
2025-09-24 18:29:46
During the European trading session on Wednesday (September 24), the Australian dollar/US dollar fell slightly from its high to 0.6620. During the Asian trading session, the Australian dollar/US dollar outperformed all other major currencies.

The Australian dollar's strong performance that day was boosted by Australia's latest Consumer Price Index (CPI) report, which showed that the year-on-year inflation rate rose to 3.0% in August from 2.8% in July, exceeding expectations of 2.9% and hitting a 13-month high since July 2024.
The data suggests that with unemployment continuing to hover around historic lows, the Reserve Bank of Australia has less urgency to cut interest rates at its monetary policy meeting on September 29-30. However, investors still believe that a cautious rate cut cycle may resume in November.
The yield spread between Australia's 2-year sovereign bond and the US 2-year Treasury bond has narrowed from -0.21% on September 23, 2025 to -0.10% currently. The narrowing of the US Treasury yield premium provides additional support for the bullish momentum of AUD/USD.
Technical Analysis
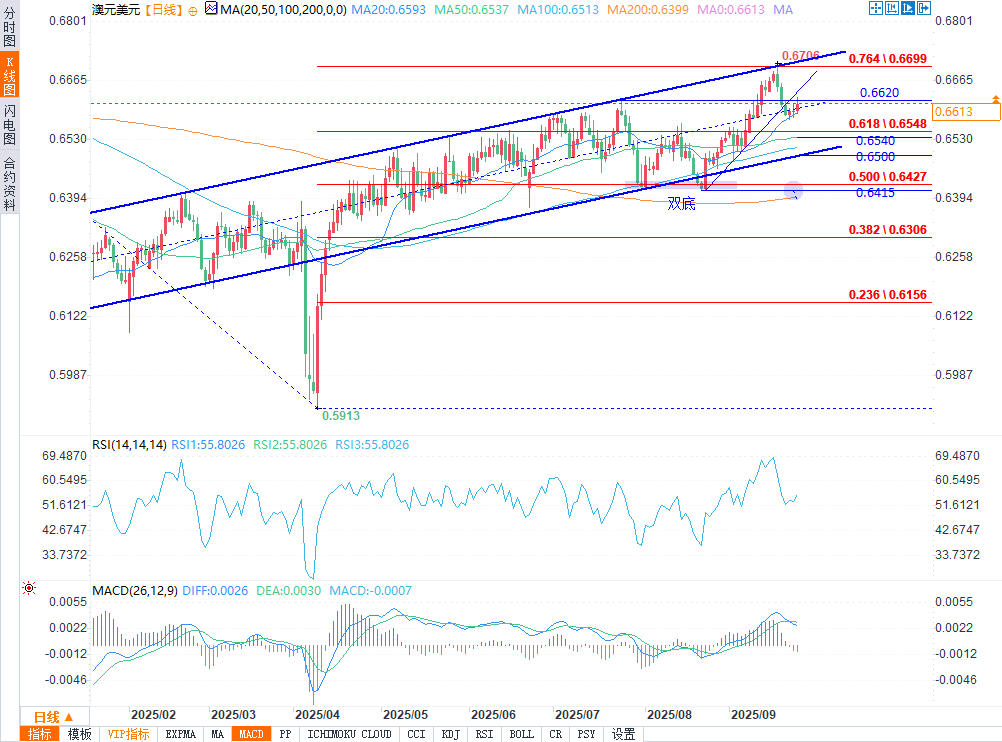
(AUD/USD daily chart source: Yihuitong)
From a technical perspective, bulls also have the upper hand. AUD/USD has decisively rebounded from its 20-day moving average (SMA), increasing the probability of a further move towards the 0.6700 level. However, traders are likely to wait and see until the pair breaks through the nearby 0.6620 level – which not only coincides with the July high but also represents a previously broken support trendline – before targeting higher levels.
Another positive sign is that the relative strength index (RSI) is preparing to turn up near the neutral 50 mark, while the stochastic indicator KDJ seems to have bottomed out in the oversold range, both confirming the current positive momentum.
On the upside, if AUD/USD breaks above the rising trend line around 0.6620, the overall bullish view will remain unchanged. The exchange rate will first test the medium-term resistance level of 0.6655, and then is expected to re-challenge the key resistance range of 0.6680/0.6700.
On the downside, only a break below the 50-day moving average (SMA) at 0.6540 could trigger an aggressive sell-off, potentially leading to a test of the double bottom formation low of 0.6415 formed in July and August. Notably, the 50% Fibonacci retracement level of the previous long-term downtrend and the 200-day moving average (SMA) are also located near this range.
Overall, AUD/USD is setting the stage for the next leg up, but bulls may need to gather momentum around 0.6620 before attempting a sustained upward move.
At 18:17 Beijing time, AUD/USD was at 0.6607/08, up 0.15%.
The Australian dollar's strong performance that day was boosted by Australia's latest Consumer Price Index (CPI) report, which showed that the year-on-year inflation rate rose to 3.0% in August from 2.8% in July, exceeding expectations of 2.9% and hitting a 13-month high since July 2024.
The data suggests that with unemployment continuing to hover around historic lows, the Reserve Bank of Australia has less urgency to cut interest rates at its monetary policy meeting on September 29-30. However, investors still believe that a cautious rate cut cycle may resume in November.
The yield spread between Australia's 2-year sovereign bond and the US 2-year Treasury bond has narrowed from -0.21% on September 23, 2025 to -0.10% currently. The narrowing of the US Treasury yield premium provides additional support for the bullish momentum of AUD/USD.
Technical Analysis
(AUD/USD daily chart source: Yihuitong)
From a technical perspective, bulls also have the upper hand. AUD/USD has decisively rebounded from its 20-day moving average (SMA), increasing the probability of a further move towards the 0.6700 level. However, traders are likely to wait and see until the pair breaks through the nearby 0.6620 level – which not only coincides with the July high but also represents a previously broken support trendline – before targeting higher levels.
Another positive sign is that the relative strength index (RSI) is preparing to turn up near the neutral 50 mark, while the stochastic indicator KDJ seems to have bottomed out in the oversold range, both confirming the current positive momentum.
On the upside, if AUD/USD breaks above the rising trend line around 0.6620, the overall bullish view will remain unchanged. The exchange rate will first test the medium-term resistance level of 0.6655, and then is expected to re-challenge the key resistance range of 0.6680/0.6700.
On the downside, only a break below the 50-day moving average (SMA) at 0.6540 could trigger an aggressive sell-off, potentially leading to a test of the double bottom formation low of 0.6415 formed in July and August. Notably, the 50% Fibonacci retracement level of the previous long-term downtrend and the 200-day moving average (SMA) are also located near this range.
Overall, AUD/USD is setting the stage for the next leg up, but bulls may need to gather momentum around 0.6620 before attempting a sustained upward move.
At 18:17 Beijing time, AUD/USD was at 0.6607/08, up 0.15%.
- Risk Warning and Disclaimer
- The market involves risk, and trading may not be suitable for all investors. This article is for reference only and does not constitute personal investment advice, nor does it take into account certain users’ specific investment objectives, financial situation, or other needs. Any investment decisions made based on this information are at your own risk.