Gold prices broke through 4050 to set a new record, while traders awaited the Fed meeting minutes
2025-10-09 01:54:44
On Wednesday (October 8), spot gold hit a new milestone, breaking through the $4,000 mark for the first time. Driven by global economic and political uncertainty and the prospect of an easing policy by the Federal Reserve, investors have flocked to this precious metal.

Spot gold was trading around $4,050 during the session, with prices continuing to hit new historical highs and having risen by more than 4% since the beginning of the week.
Gold prices saw another round of gains despite a stronger US dollar index. Political turmoil in France and Japan boosted safe-haven demand, driving inflows into both the dollar and gold. Meanwhile, the ongoing US government shutdown exacerbated market panic, further supporting gold demand.
Ongoing geopolitical risks, including the Russia-Ukraine war, tensions in the Middle East, and concerns about global trade disruptions, have further strengthened gold's safe-haven appeal. Furthermore, continued gold purchases by central banks and strong inflows into gold exchange-traded funds (ETFs) have supported gold's record-breaking rally.
According to data from consulting firm MetalsFocus, global central banks are expected to purchase 1,000 tons of gold in 2025, marking the fourth consecutive year of significant gold purchases. Central banks are shifting their foreign exchange reserves from US dollar assets to gold to achieve reserve diversification.
A Deutsche Bank report showed that U.S. Treasury yields fell across the board. Investors slightly increased their bets on the Federal Reserve accelerating interest rate cuts in the coming months, with the market predicting a cumulative 111 basis points of rate cuts by December 2026. The CME FedWatch tool shows that the market believes there is a 94.6% probability that the Fed will cut interest rates by 25 basis points at the Federal Open Market Committee (FOMC) meeting on October 29-30.
Technical analysis: Spot gold continues to rise, but overbought signals indicate the risk of a pullback
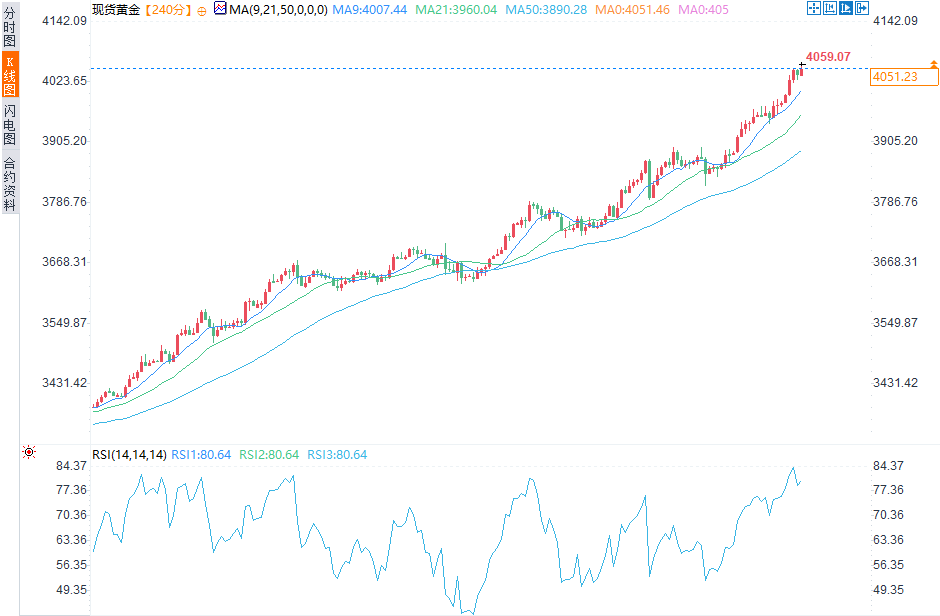
(Source of spot gold 4-hour chart: Yihuitong)
Despite signs of overextension, gold's buying momentum remains unabated, extending its historic rally. From a technical perspective, the current rally is clearly stretched, with the monthly Relative Strength Index (RSI) breaking above 90 for the first time since the 1980s, highlighting the risk of short-term overheating.
Momentum indicators are also high on shorter timeframes. On the 4-hour chart, the RSI remains in overbought territory near 80. This suggests that while the overall trend remains strongly bullish, the likelihood of a correction or sideways movement has increased as traders book profits and reassess their positions.
On the 4-hour chart, the 9-period Simple Moving Average (SMA) provides immediate support near the $4,000 mark. If prices fall further, the 21-period SMA will become the next downside support. On the upside, resistance lies near $4,050. A decisive break above this level could trigger further profit-taking in the $4,100 area.
Spot gold was trading around $4,050 during the session, with prices continuing to hit new historical highs and having risen by more than 4% since the beginning of the week.
Gold prices saw another round of gains despite a stronger US dollar index. Political turmoil in France and Japan boosted safe-haven demand, driving inflows into both the dollar and gold. Meanwhile, the ongoing US government shutdown exacerbated market panic, further supporting gold demand.
Ongoing geopolitical risks, including the Russia-Ukraine war, tensions in the Middle East, and concerns about global trade disruptions, have further strengthened gold's safe-haven appeal. Furthermore, continued gold purchases by central banks and strong inflows into gold exchange-traded funds (ETFs) have supported gold's record-breaking rally.
According to data from consulting firm MetalsFocus, global central banks are expected to purchase 1,000 tons of gold in 2025, marking the fourth consecutive year of significant gold purchases. Central banks are shifting their foreign exchange reserves from US dollar assets to gold to achieve reserve diversification.
A Deutsche Bank report showed that U.S. Treasury yields fell across the board. Investors slightly increased their bets on the Federal Reserve accelerating interest rate cuts in the coming months, with the market predicting a cumulative 111 basis points of rate cuts by December 2026. The CME FedWatch tool shows that the market believes there is a 94.6% probability that the Fed will cut interest rates by 25 basis points at the Federal Open Market Committee (FOMC) meeting on October 29-30.
Technical analysis: Spot gold continues to rise, but overbought signals indicate the risk of a pullback
(Source of spot gold 4-hour chart: Yihuitong)
Despite signs of overextension, gold's buying momentum remains unabated, extending its historic rally. From a technical perspective, the current rally is clearly stretched, with the monthly Relative Strength Index (RSI) breaking above 90 for the first time since the 1980s, highlighting the risk of short-term overheating.
Momentum indicators are also high on shorter timeframes. On the 4-hour chart, the RSI remains in overbought territory near 80. This suggests that while the overall trend remains strongly bullish, the likelihood of a correction or sideways movement has increased as traders book profits and reassess their positions.
On the 4-hour chart, the 9-period Simple Moving Average (SMA) provides immediate support near the $4,000 mark. If prices fall further, the 21-period SMA will become the next downside support. On the upside, resistance lies near $4,050. A decisive break above this level could trigger further profit-taking in the $4,100 area.
- Risk Warning and Disclaimer
- The market involves risk, and trading may not be suitable for all investors. This article is for reference only and does not constitute personal investment advice, nor does it take into account certain users’ specific investment objectives, financial situation, or other needs. Any investment decisions made based on this information are at your own risk.