OPEC+ presses the "pause button" on production increases, oil prices hold firm at the $60 level.
2025-11-03 14:28:09
US crude oil futures rose slightly on Monday (November 3), gaining approximately 0.69% to trade around $61.40 per barrel. This followed OPEC+'s decision to suspend its planned production increase scheduled for the first quarter of 2026. This decision, along with easing trade tensions, stabilized market sentiment and strengthened expectations of improved global growth. With crude oil prices holding above $60, the market is closely watching for further confirmation of the economic recovery momentum amid widening yield spreads and improved market breadth.
OPEC+ has decided to suspend its planned production increase scheduled for the first quarter of 2026. The organization has agreed to increase production by 137,000 barrels per day in December, the same increase as in October and November.
The easing of trade tensions is a positive sign for global growth expectations and could provide a long-awaited bullish catalyst for oil bulls.
The spread between the US 2-year and 10-year Treasury yields can serve as a leading indicator of economic growth. Notably, after consolidating sideways since April, this spread is now showing signs of turning upwards. However, for oil traders to anticipate a substantial price increase, it remains to be seen whether the 2-year/10-year yield spread can sustain its strength and achieve a decisive breakout. Currently, oil prices have at least signaled a recent minor rebound.
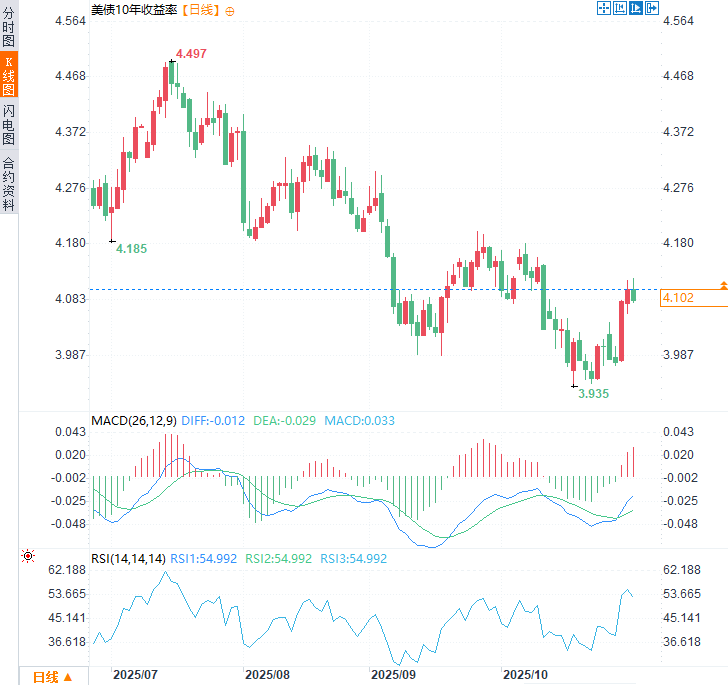
(10-year US Treasury yield, source: EasyTrade)
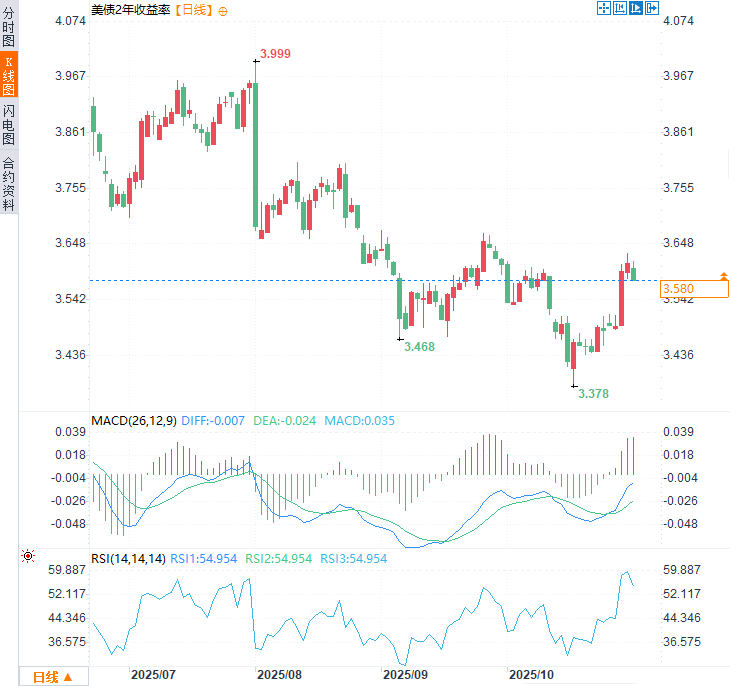
(2-year US Treasury yield, source: EasyTrade)
Oil prices showed a solid bullish reversal in the second half of October, leaving a significant "hammer" pattern on the monthly chart. Although oil prices have been trading sideways within a range for the past two years, they still show considerable upside potential on the daily and weekly timeframes.
It is worth noting that oil prices ended a three-week losing streak with a bullish engulfing candlestick pattern, marking their best weekly performance in 20 weeks, suggesting that a significant swing low may have formed around $56.
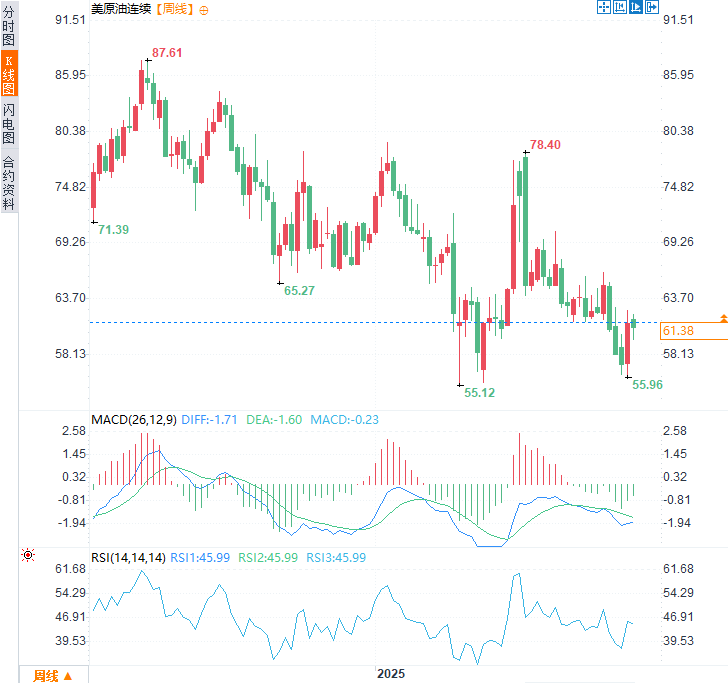
(US crude oil weekly chart, source: FX678)
The daily chart shows that oil prices gapped up from around $58 to above $60 two weeks ago—a level that had been a key pivot point for the previous months. Currently, oil prices are showing signs of stabilizing above this key level, and market momentum is gradually strengthening, driven by three consecutive days of buying by oil traders.
On the upside, the October volume distribution center ($61.65) and the 50-day moving average ($61.90) are expected to provide initial resistance, which could improve the potential risk-reward ratio, with prices expected to break through the near three-week high of $62.59.
If oil prices successfully break through the $62.60 level, they could potentially test recent highs below $66. Whether oil bulls can retest or effectively break through these resistance levels will likely depend on global growth expectations and the specific trend of the US 2-10 year Treasury yield spread.
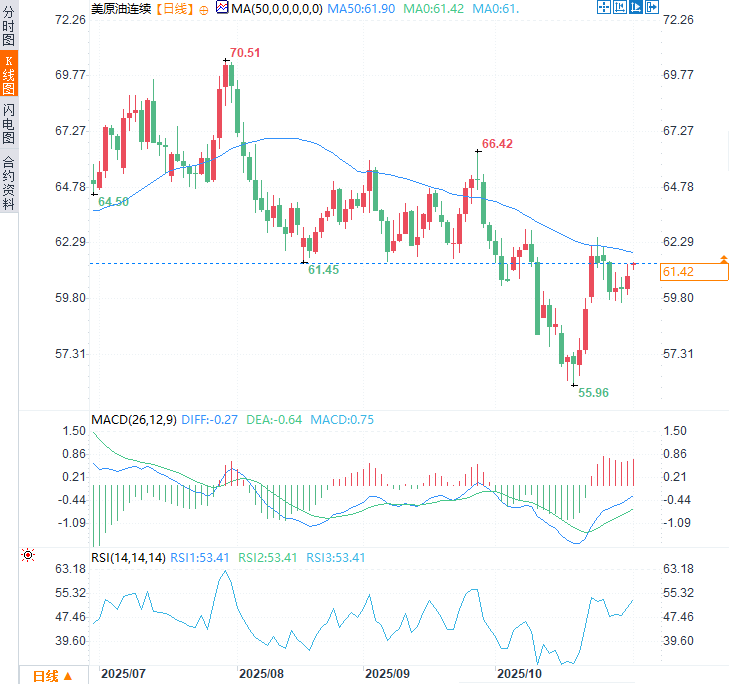
(US crude oil daily chart, source: FX678)
At 14:27 Beijing time, US crude oil futures were trading at $61.38 per barrel.
The combined boost from OPEC+'s suspension of production cuts and the trade truce has improved sentiment in the crude oil market.
OPEC+ has decided to suspend its planned production increase scheduled for the first quarter of 2026. The organization has agreed to increase production by 137,000 barrels per day in December, the same increase as in October and November.
The easing of trade tensions is a positive sign for global growth expectations and could provide a long-awaited bullish catalyst for oil bulls.
The widening US 2-10 year interest rate spread may further boost oil prices.
The spread between the US 2-year and 10-year Treasury yields can serve as a leading indicator of economic growth. Notably, after consolidating sideways since April, this spread is now showing signs of turning upwards. However, for oil traders to anticipate a substantial price increase, it remains to be seen whether the 2-year/10-year yield spread can sustain its strength and achieve a decisive breakout. Currently, oil prices have at least signaled a recent minor rebound.
(10-year US Treasury yield, source: EasyTrade)
(2-year US Treasury yield, source: EasyTrade)
Technical Analysis
Oil prices showed a solid bullish reversal in the second half of October, leaving a significant "hammer" pattern on the monthly chart. Although oil prices have been trading sideways within a range for the past two years, they still show considerable upside potential on the daily and weekly timeframes.
It is worth noting that oil prices ended a three-week losing streak with a bullish engulfing candlestick pattern, marking their best weekly performance in 20 weeks, suggesting that a significant swing low may have formed around $56.
(US crude oil weekly chart, source: FX678)
The daily chart shows that oil prices gapped up from around $58 to above $60 two weeks ago—a level that had been a key pivot point for the previous months. Currently, oil prices are showing signs of stabilizing above this key level, and market momentum is gradually strengthening, driven by three consecutive days of buying by oil traders.
On the upside, the October volume distribution center ($61.65) and the 50-day moving average ($61.90) are expected to provide initial resistance, which could improve the potential risk-reward ratio, with prices expected to break through the near three-week high of $62.59.
If oil prices successfully break through the $62.60 level, they could potentially test recent highs below $66. Whether oil bulls can retest or effectively break through these resistance levels will likely depend on global growth expectations and the specific trend of the US 2-10 year Treasury yield spread.
(US crude oil daily chart, source: FX678)
At 14:27 Beijing time, US crude oil futures were trading at $61.38 per barrel.
- Risk Warning and Disclaimer
- The market involves risk, and trading may not be suitable for all investors. This article is for reference only and does not constitute personal investment advice, nor does it take into account certain users’ specific investment objectives, financial situation, or other needs. Any investment decisions made based on this information are at your own risk.