Crude Oil Storm: Surge in Inventories vs. Geopolitical Conflicts – Oil Market Engulfed in a Battle Between Bulls and Bears
2025-11-05 14:47:44
On Wednesday (November 5), during the European session, West Texas Intermediate (WTI) crude oil, the US benchmark, fluctuated around $60.65 per barrel. The market appeared to be in a wait-and-see mode, influenced by a significant increase in US API crude oil inventories and escalating geopolitical tensions.

The American Petroleum Institute (API) reported that U.S. crude oil inventories surged by 6.5 million barrels in the week ending October 31. According to Oilprice's calculations based on API data, U.S. crude oil inventories have seen a net increase of 3.6 million barrels this year.
The U.S. Department of Energy reported earlier this week that crude oil inventories in the Strategic Petroleum Reserve (SPR) increased by 500,000 barrels to 409.6 million barrels in the week ending October 31. This move is part of the administration's efforts to replenish the nation's oil reserves, which have been shrinking throughout Biden's term.
According to data from the U.S. Energy Information Administration, U.S. crude oil production rose to 13.644 million barrels per day in the week ending October 24, an increase of 109,000 barrels per day from the beginning of the year, setting a new record based on EIA weekly data.
Gasoline inventories fell sharply by 5.653 million barrels in the week ending October 31, following a decrease of 6.3 million barrels the previous week. As of last week, gasoline inventories were 3% below the five-year average for the same period.
Markets are closely watching attacks on Russian infrastructure following Ukrainian President Zelensky's announcement last month of an intensified offensive.
Kyiv claimed responsibility for the attack on Lukoil's refinery in Nizhny Novgorod Oblast, a facility that processes approximately 340,000 barrels of crude oil per day.
In the past week, the Tuapse and Saratov refineries were also attacked. Any sign of escalation could push oil prices higher.
The restrained tone of oil price movements reflects that the market is caught between signs of weak demand and lingering supply concerns.
On the demand side, investors remain cautious about the global growth outlook, especially as slowing industrial activity and weak energy consumption in Asia are dragging down expectations.
Meanwhile, the recent strength of the US dollar has exacerbated the pressure, making dollar-denominated crude oil less attractive to holders of other currencies. The US dollar index had previously risen for five consecutive trading days, breaking through the 100 mark, and fluctuated at a high level of around 100.12 on Wednesday.
Against this backdrop, OPEC+ is attempting to control supply by pledging to halt production increases in early 2026 (previously planned for a modest increase in December). However, recent price movements suggest that OPEC+'s measures may struggle to provide substantial support in the short term if demand fails to strengthen.
With continued growth in production from non-OPEC+ oil-producing countries and reduced incremental crude oil absorption by Asian refineries, the global oil market is showing signs of a mild oversupply.
The market appears reluctant to push prices higher without a strong demand catalyst or a sudden supply disruption. It seems to be in a wait-and-see mode, awaiting a clearer directional signal.
Signs of rapidly deteriorating demand could depress oil prices, while unexpected inventory reductions or geopolitical turmoil in Venezuela or even Nigeria could trigger price increases.
The market is closely watching the U.S. Energy Information Administration (EIA) crude oil inventory report, which will be released later on Wednesday.
Oil prices are currently locked in a fierce battle between bulls and bears, hovering around the $59.64-$61.94 range. This intense struggle has continued since October 27th.
The Relative Strength Index (RSI) is near the midline on the 14th, indicating that oil prices lack a clear direction in the short term.
On the upside, the top of the $61.94 trading range presents strong resistance. The 100-day and 200-day exponential moving averages (EMAs) provide dynamic resistance at $62.91 and $64.61, respectively.
On the downside, the bottom of the $59.64 trading range and $59.00 form an initial support zone. If this support zone is broken, the next support level to watch is the low of $58.22 on October 10.
(US crude oil daily chart, source: FX678)
At 14:47 Beijing time, US crude oil futures were trading at $60.64 per barrel.
A report from the American Petroleum Institute showed a significant increase in crude oil inventories.
The American Petroleum Institute (API) reported that U.S. crude oil inventories surged by 6.5 million barrels in the week ending October 31. According to Oilprice's calculations based on API data, U.S. crude oil inventories have seen a net increase of 3.6 million barrels this year.
The U.S. Department of Energy reported earlier this week that crude oil inventories in the Strategic Petroleum Reserve (SPR) increased by 500,000 barrels to 409.6 million barrels in the week ending October 31. This move is part of the administration's efforts to replenish the nation's oil reserves, which have been shrinking throughout Biden's term.
According to data from the U.S. Energy Information Administration, U.S. crude oil production rose to 13.644 million barrels per day in the week ending October 24, an increase of 109,000 barrels per day from the beginning of the year, setting a new record based on EIA weekly data.
Gasoline inventories fell sharply by 5.653 million barrels in the week ending October 31, following a decrease of 6.3 million barrels the previous week. As of last week, gasoline inventories were 3% below the five-year average for the same period.
Geopolitical risks may provide support for oil prices.
Markets are closely watching attacks on Russian infrastructure following Ukrainian President Zelensky's announcement last month of an intensified offensive.
Kyiv claimed responsibility for the attack on Lukoil's refinery in Nizhny Novgorod Oblast, a facility that processes approximately 340,000 barrels of crude oil per day.
In the past week, the Tuapse and Saratov refineries were also attacked. Any sign of escalation could push oil prices higher.
The oil market is caught between signs of weak demand and persistent supply concerns.
The restrained tone of oil price movements reflects that the market is caught between signs of weak demand and lingering supply concerns.
On the demand side, investors remain cautious about the global growth outlook, especially as slowing industrial activity and weak energy consumption in Asia are dragging down expectations.
Meanwhile, the recent strength of the US dollar has exacerbated the pressure, making dollar-denominated crude oil less attractive to holders of other currencies. The US dollar index had previously risen for five consecutive trading days, breaking through the 100 mark, and fluctuated at a high level of around 100.12 on Wednesday.
Against this backdrop, OPEC+ is attempting to control supply by pledging to halt production increases in early 2026 (previously planned for a modest increase in December). However, recent price movements suggest that OPEC+'s measures may struggle to provide substantial support in the short term if demand fails to strengthen.
With continued growth in production from non-OPEC+ oil-producing countries and reduced incremental crude oil absorption by Asian refineries, the global oil market is showing signs of a mild oversupply.
The market appears reluctant to push prices higher without a strong demand catalyst or a sudden supply disruption. It seems to be in a wait-and-see mode, awaiting a clearer directional signal.
Signs of rapidly deteriorating demand could depress oil prices, while unexpected inventory reductions or geopolitical turmoil in Venezuela or even Nigeria could trigger price increases.
The market is closely watching the U.S. Energy Information Administration (EIA) crude oil inventory report, which will be released later on Wednesday.
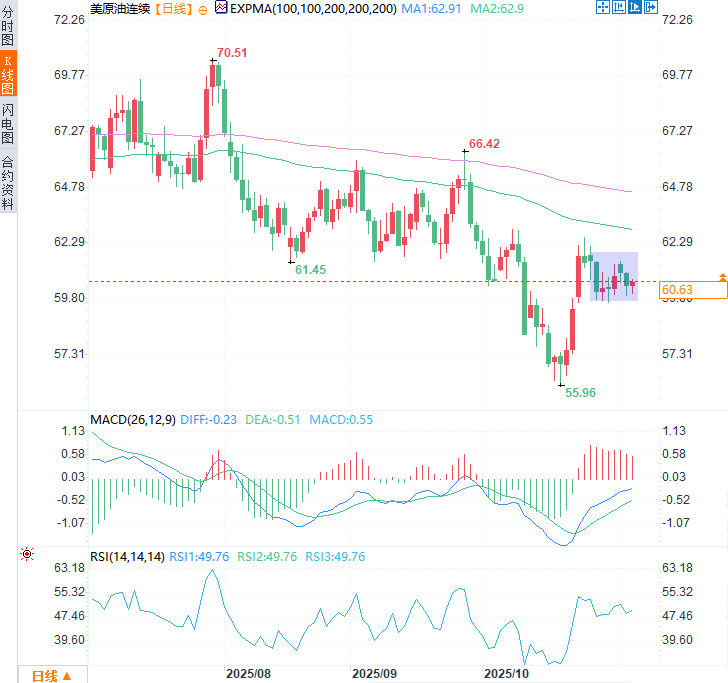
Technical Analysis
Oil prices are currently locked in a fierce battle between bulls and bears, hovering around the $59.64-$61.94 range. This intense struggle has continued since October 27th.
The Relative Strength Index (RSI) is near the midline on the 14th, indicating that oil prices lack a clear direction in the short term.
On the upside, the top of the $61.94 trading range presents strong resistance. The 100-day and 200-day exponential moving averages (EMAs) provide dynamic resistance at $62.91 and $64.61, respectively.
On the downside, the bottom of the $59.64 trading range and $59.00 form an initial support zone. If this support zone is broken, the next support level to watch is the low of $58.22 on October 10.
(US crude oil daily chart, source: FX678)
At 14:47 Beijing time, US crude oil futures were trading at $60.64 per barrel.
- Risk Warning and Disclaimer
- The market involves risk, and trading may not be suitable for all investors. This article is for reference only and does not constitute personal investment advice, nor does it take into account certain users’ specific investment objectives, financial situation, or other needs. Any investment decisions made based on this information are at your own risk.