Gold Price Outlook: Support remains on dips; further upside depends on non-farm payroll data.
2026-01-09 02:26:41
Gold prices edged lower in early US trading on Thursday (January 8), with the market remaining cautious as it awaited the release of non-farm payroll data. From a long-term perspective, the upward trend in gold prices is unlikely to change easily, but in the short term, the market needs to digest this crucial data before it can regain upward momentum.

If gold prices continue to fall from their current levels to around $4,325, this could be considered an attractive buying opportunity. Of course, the market might not allow such a pullback at all. It's important to note that the trend of global central banks continuously increasing their gold holdings continues, and given the current massive global debt, gold's demand base remains solid as an important tool for hedging risk and optimizing balance sheets. This will provide long-term support for gold prices.
Technical Analysis and Target Price
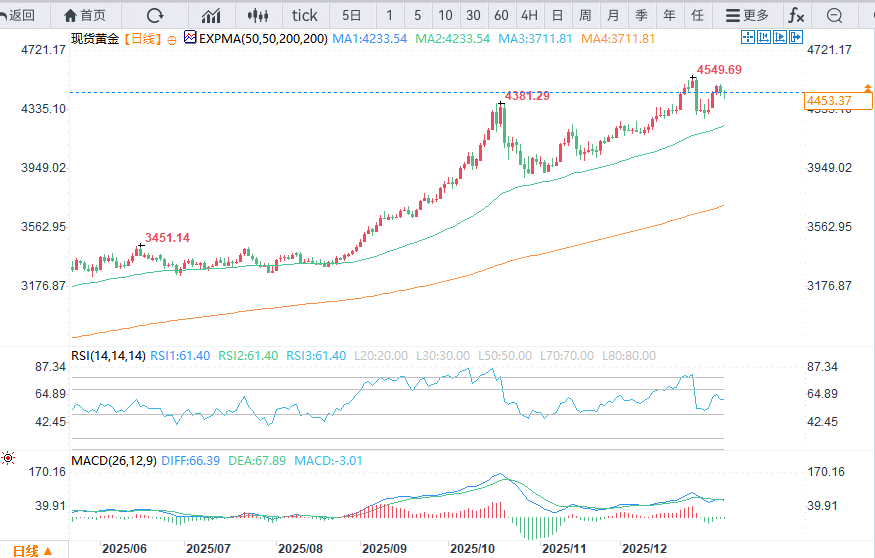
(Spot gold daily chart source: FX678)
From a technical perspective, gold broke out of a consolidating triangle pattern, subsequently retraced, and successfully rebounded. This is a typical confirmation pattern after a breakout, a relatively reliable signal in technical analysis. If it weren't for the upcoming non-farm payroll data release this Friday, the bullish trend for gold might have been even stronger. This isn't a bearish view, but rather a consideration that non-farm payroll data often triggers significant market volatility, potentially disrupting short-term price movements.
It's worth noting that the ascending trendline of the triangle pattern intersects with the 50-day exponential moving average (EMA) in the same area, further strengthening the support around $4,300. Only if gold prices decisively break below this key support will we need to seriously discuss whether gold will experience a deeper pullback.
Based on volume analysis of the triangle pattern, the theoretical upside target is $4,900. This level is expected to be achieved later this year and is within a reasonable and anticipated target range.
If gold prices continue to fall from their current levels to around $4,325, this could be considered an attractive buying opportunity. Of course, the market might not allow such a pullback at all. It's important to note that the trend of global central banks continuously increasing their gold holdings continues, and given the current massive global debt, gold's demand base remains solid as an important tool for hedging risk and optimizing balance sheets. This will provide long-term support for gold prices.
Technical Analysis and Target Price
(Spot gold daily chart source: FX678)
From a technical perspective, gold broke out of a consolidating triangle pattern, subsequently retraced, and successfully rebounded. This is a typical confirmation pattern after a breakout, a relatively reliable signal in technical analysis. If it weren't for the upcoming non-farm payroll data release this Friday, the bullish trend for gold might have been even stronger. This isn't a bearish view, but rather a consideration that non-farm payroll data often triggers significant market volatility, potentially disrupting short-term price movements.
It's worth noting that the ascending trendline of the triangle pattern intersects with the 50-day exponential moving average (EMA) in the same area, further strengthening the support around $4,300. Only if gold prices decisively break below this key support will we need to seriously discuss whether gold will experience a deeper pullback.
Based on volume analysis of the triangle pattern, the theoretical upside target is $4,900. This level is expected to be achieved later this year and is within a reasonable and anticipated target range.
- Risk Warning and Disclaimer
- The market involves risk, and trading may not be suitable for all investors. This article is for reference only and does not constitute personal investment advice, nor does it take into account certain users’ specific investment objectives, financial situation, or other needs. Any investment decisions made based on this information are at your own risk.