Non-Farm Payrolls Preview: A Comprehensive Overview of Expectations with Eight Charts + Gold Analysis – Will Gold Prices Face New Negative Factors?
2026-01-09 11:57:30
The highly anticipated US December non-farm payrolls report will be released on Friday (January 9, 2026, 21:30). Based on forecasts from over 58 internationally renowned investment banks and financial experts, the expected non-farm payrolls increase is 60,000, the unemployment rate is expected to be 4.5%, and the average hourly wage annual growth rate is expected to be 3.6%. This article uses eight charts to provide a preview of the non-farm payrolls report from various perspectives.
Figure 1 shows what's touted as a "Smarter" forecast for non-farm payrolls: an increase of 63,700, potentially suggesting a stronger-than-expected non-farm payrolls figure. However, as shown in Figure 5, the latest "leading indicators" for non-farm payrolls are generally mixed.
(For a detailed analysis of the impact on gold prices, plus two charts showing technical analysis of gold prices, see the bottom of this article.)
The charts in this article show the expected data of each institution, as well as the expected mean, mode, maximum, minimum, and prediction intervals for three confidence levels calculated based on the survey results. See the table below for details.
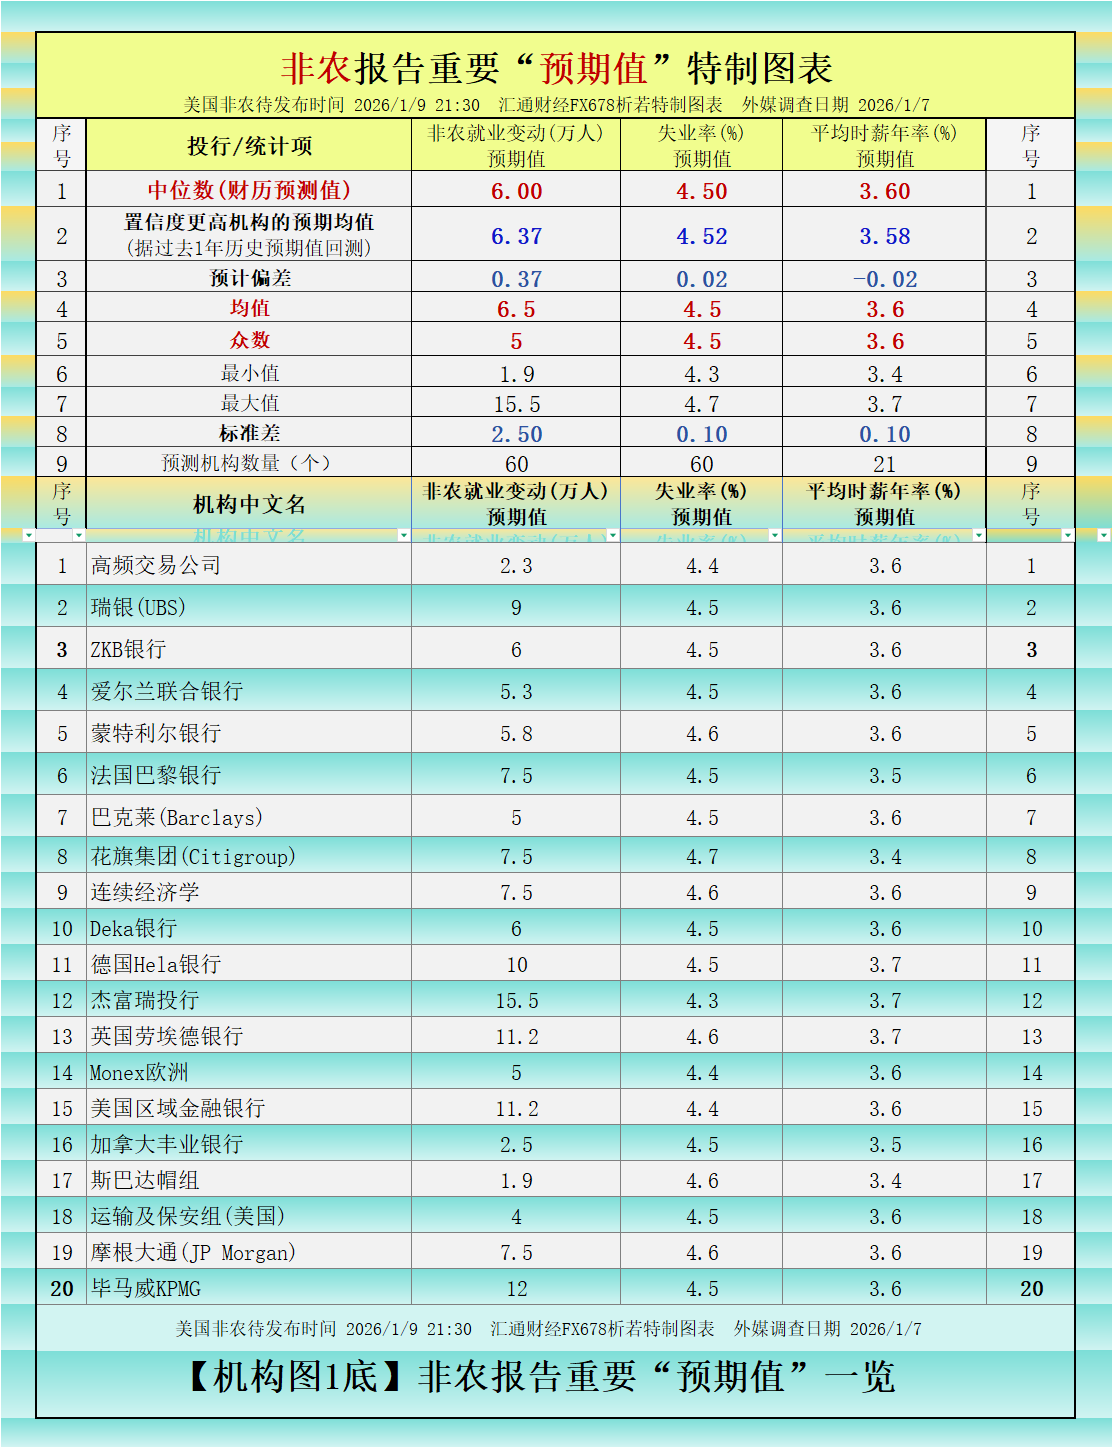
As shown in Figure 1 above, there are 20 institutions/experts who have given expected values for all three indicators.

As shown in Figure 2 above, there are 36 institutions/experts that only provide expected values for two indicators, and 2 institutions/experts that only provide expected values for one indicator (Source: FX678 Special Chart).
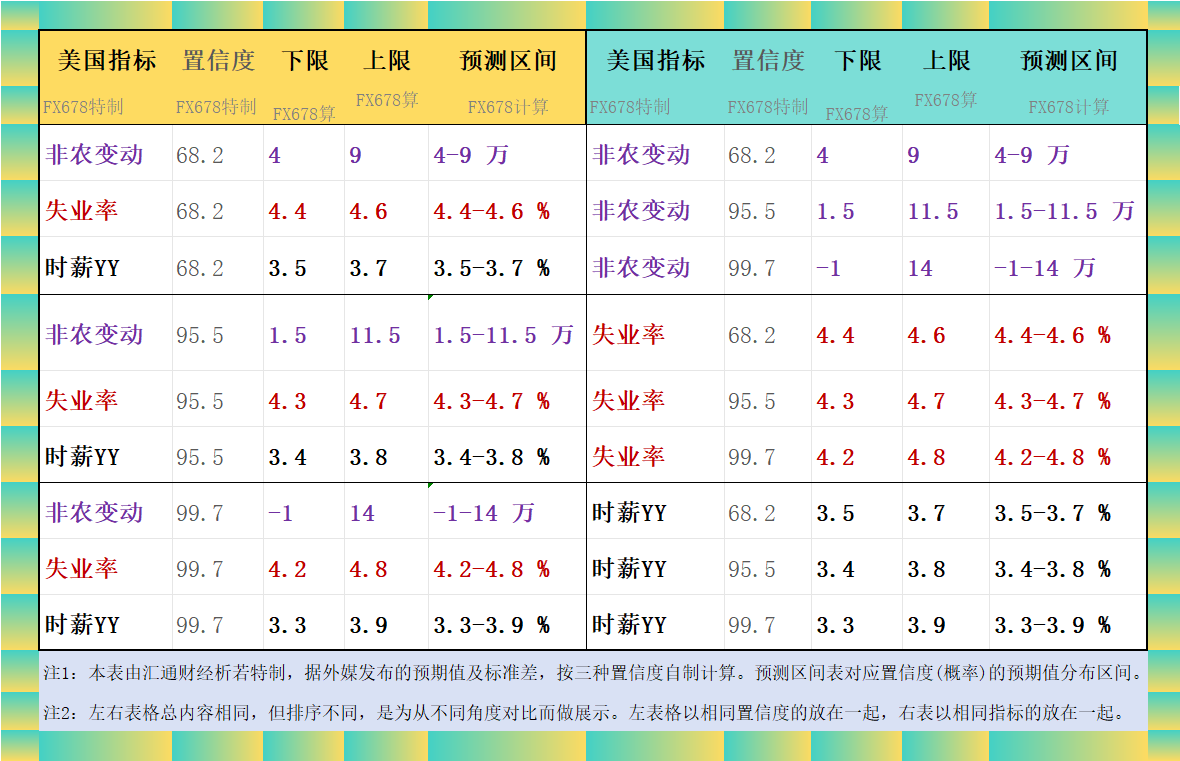
[Figure 3 below shows the expected ranges corresponding to confidence levels of 68.2%, 95.5%, and 99.7% for non-farm payrolls, unemployment rate, and annual wage rate, based on the principle of normal distribution.]
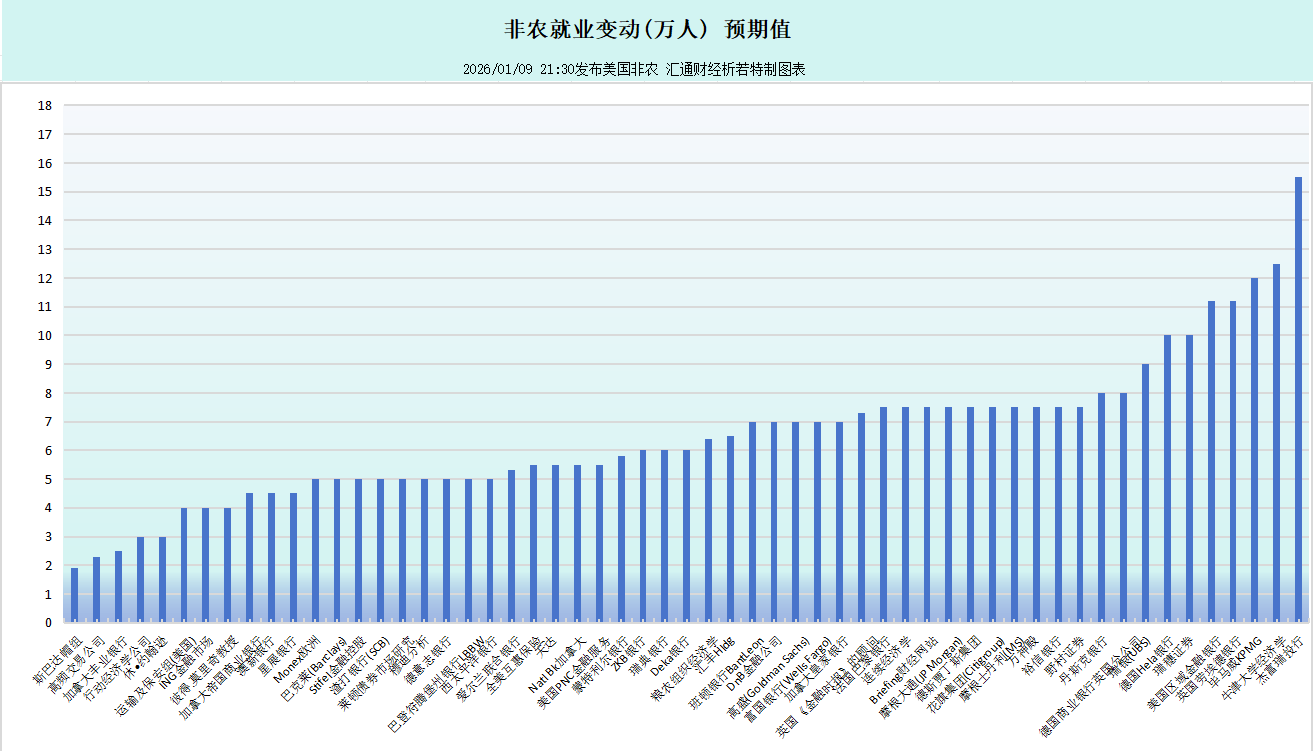
[Figure 4 below: Overview of institutional expectations for non-farm payroll changes :]
[Figure 5 below: A summary of institutional expectations for the unemployment rate :]

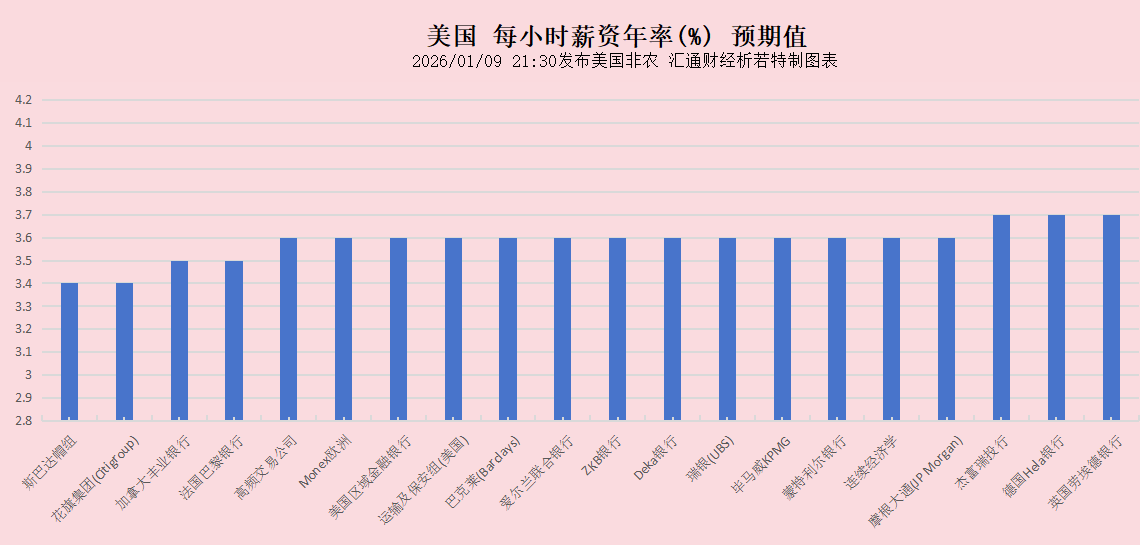
[Figure 6 below: Overview of various institutions' expectations for annual salary rates :]
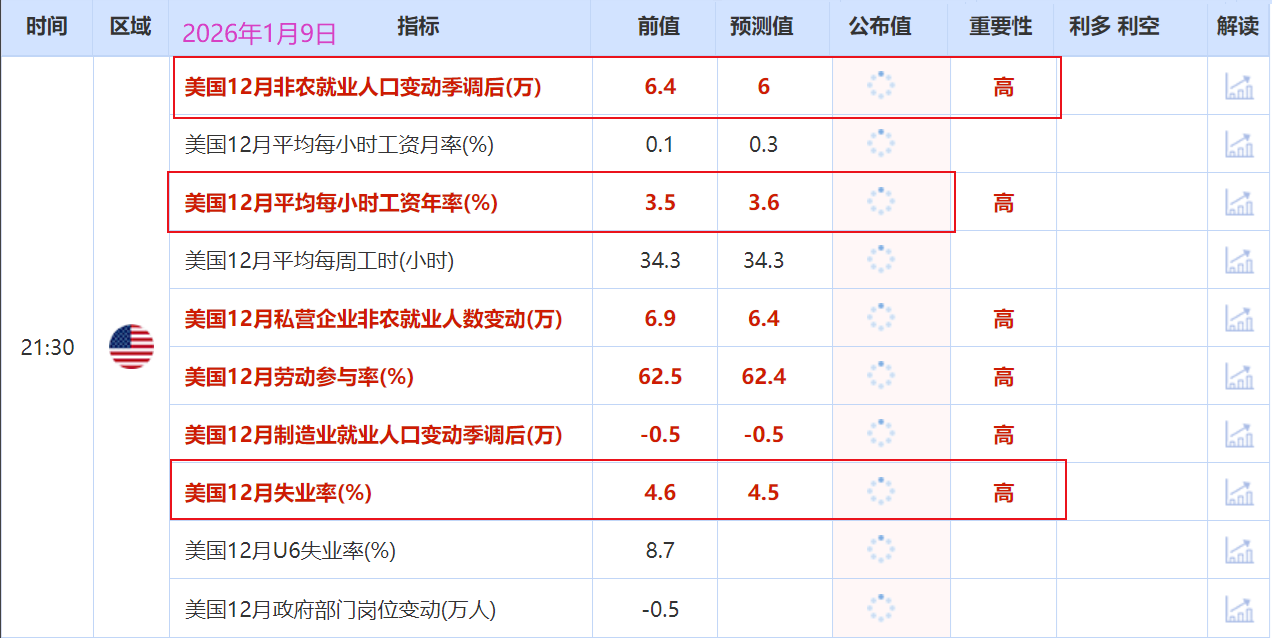
[Figure 7 below shows the details of tonight's non-farm payrolls report and its sub-items on the economic calendar page :]
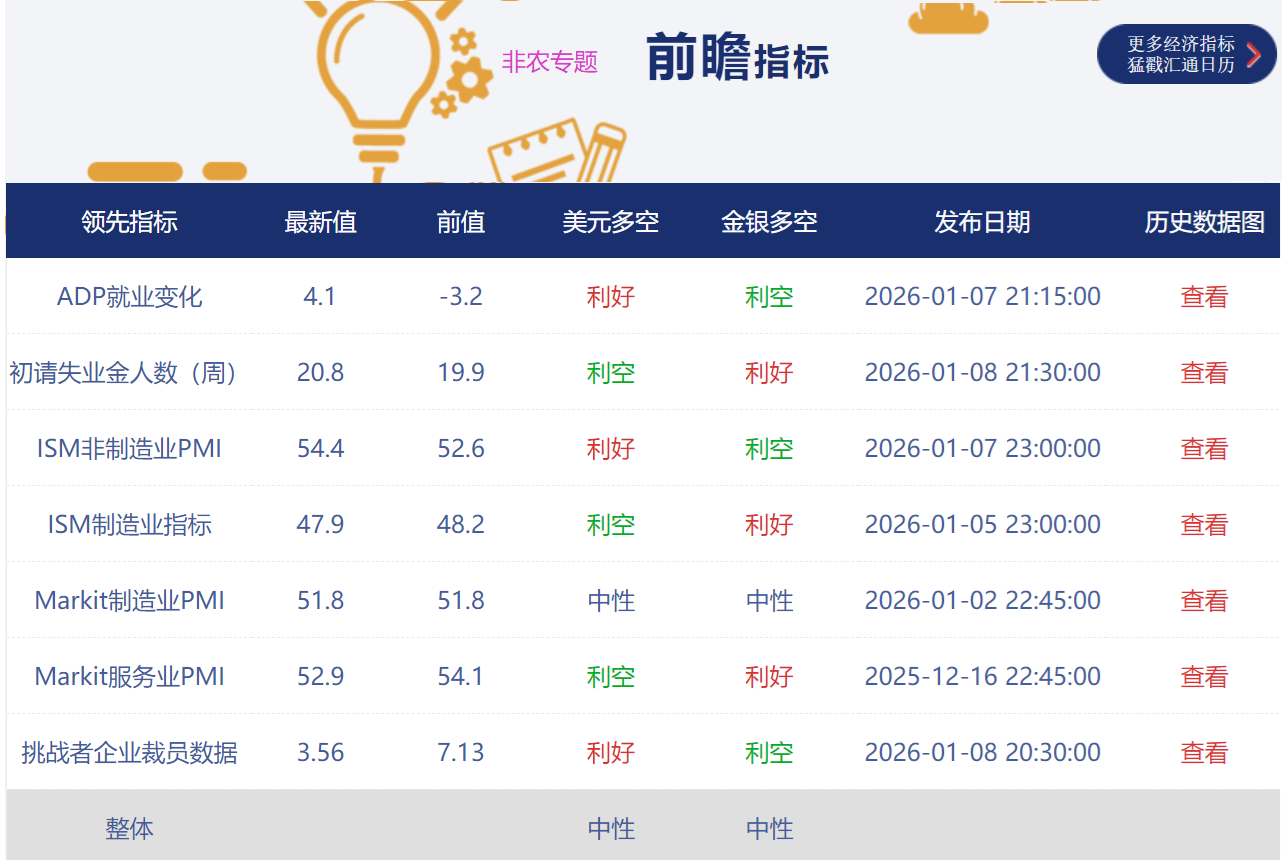
[Figure 8 below shows the latest US "Non-Farm Leading Indicators" released from December 16 to January 8. The overall picture is mixed, suggesting that the US job market may be lukewarm (see FX678 Non-Farm Payrolls Special Report for more details).]
It's important to note that even the most authoritative institutions can make inaccurate predictions. There have been instances where non-farm payroll results were stronger than the strongest expectations, and instances where the released figures were weaker than any institution's forecast. However, market investors base their strategies on these predictions, and the market's reaction is influenced by these expected values, affecting both bullish and bearish adjustments and market sentiment. Therefore, studying the predicted values in advance remains crucial.
Below is a simple analysis of gold.
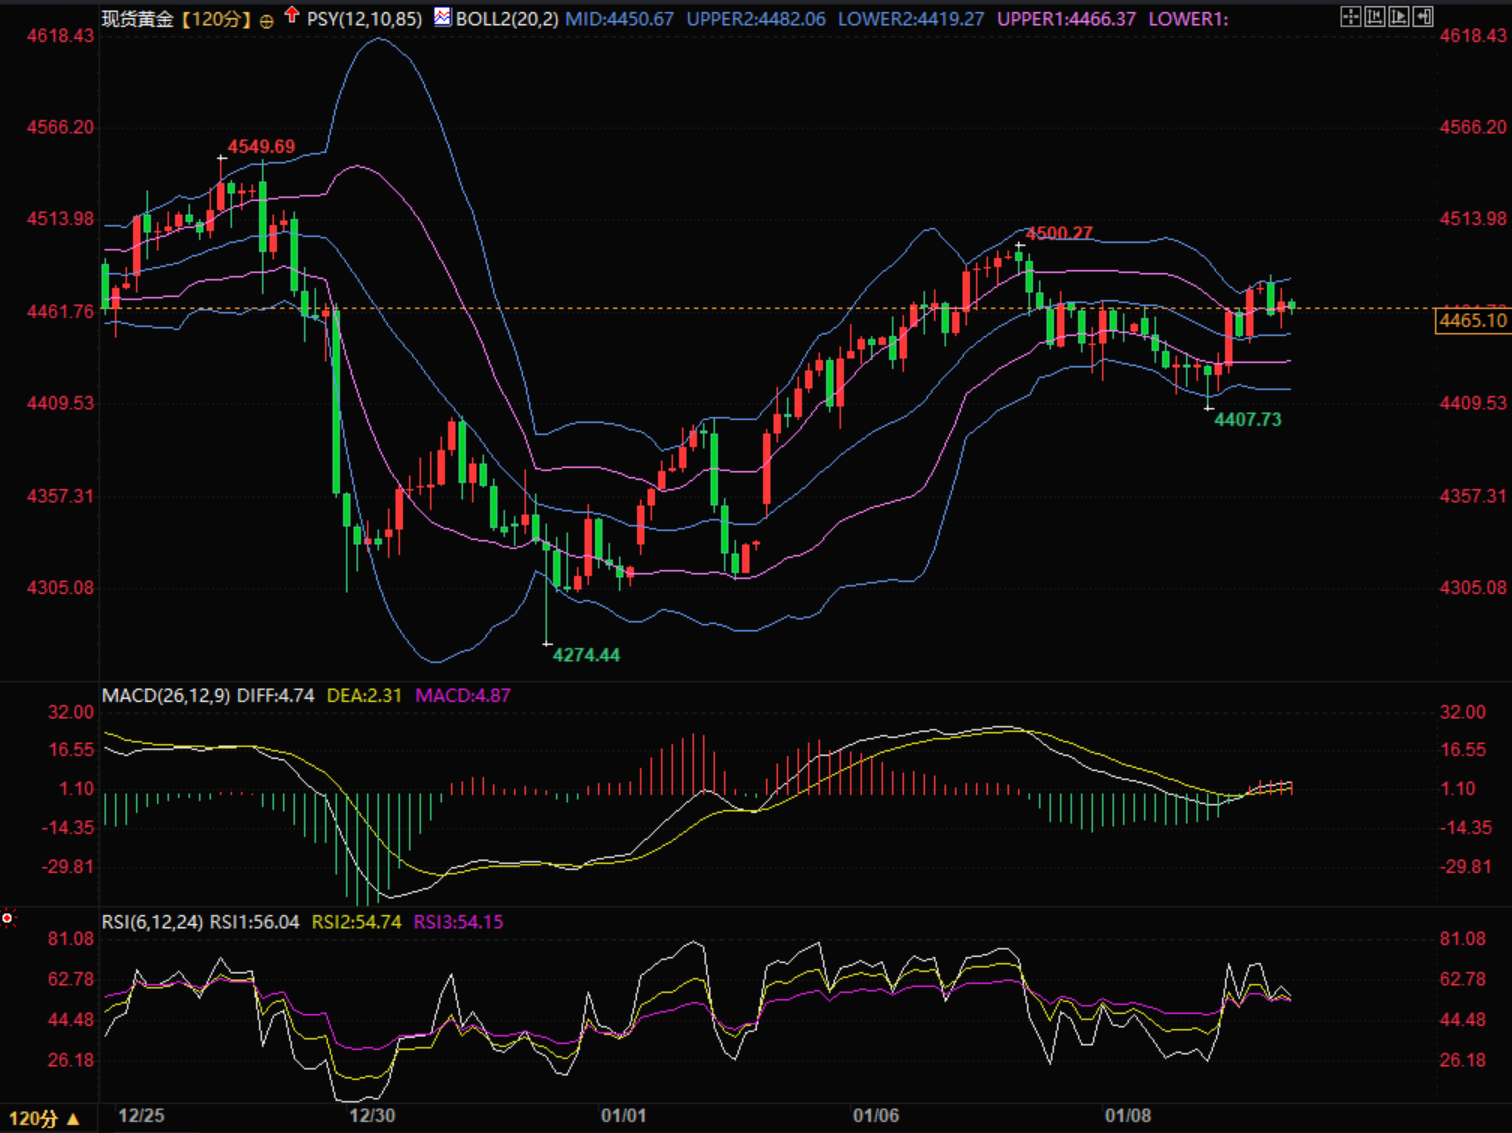
As shown in Figure 9 below, the gold price is currently moving neatly along the Bollinger Bands on the 2-hour chart. When the price reaches the upper, middle, or lower bands, pay attention to whether it encounters resistance or support. You can also refer to the 15-minute or 30-minute charts for further analysis.
As shown in Figure 10 below, the gold price is currently focused on the triangle area formed by the yellow diagonal line. If it breaks through, then focus on the area formed by the two pink solid lines. If it breaks through again, then focus on the corresponding pink dashed lines.
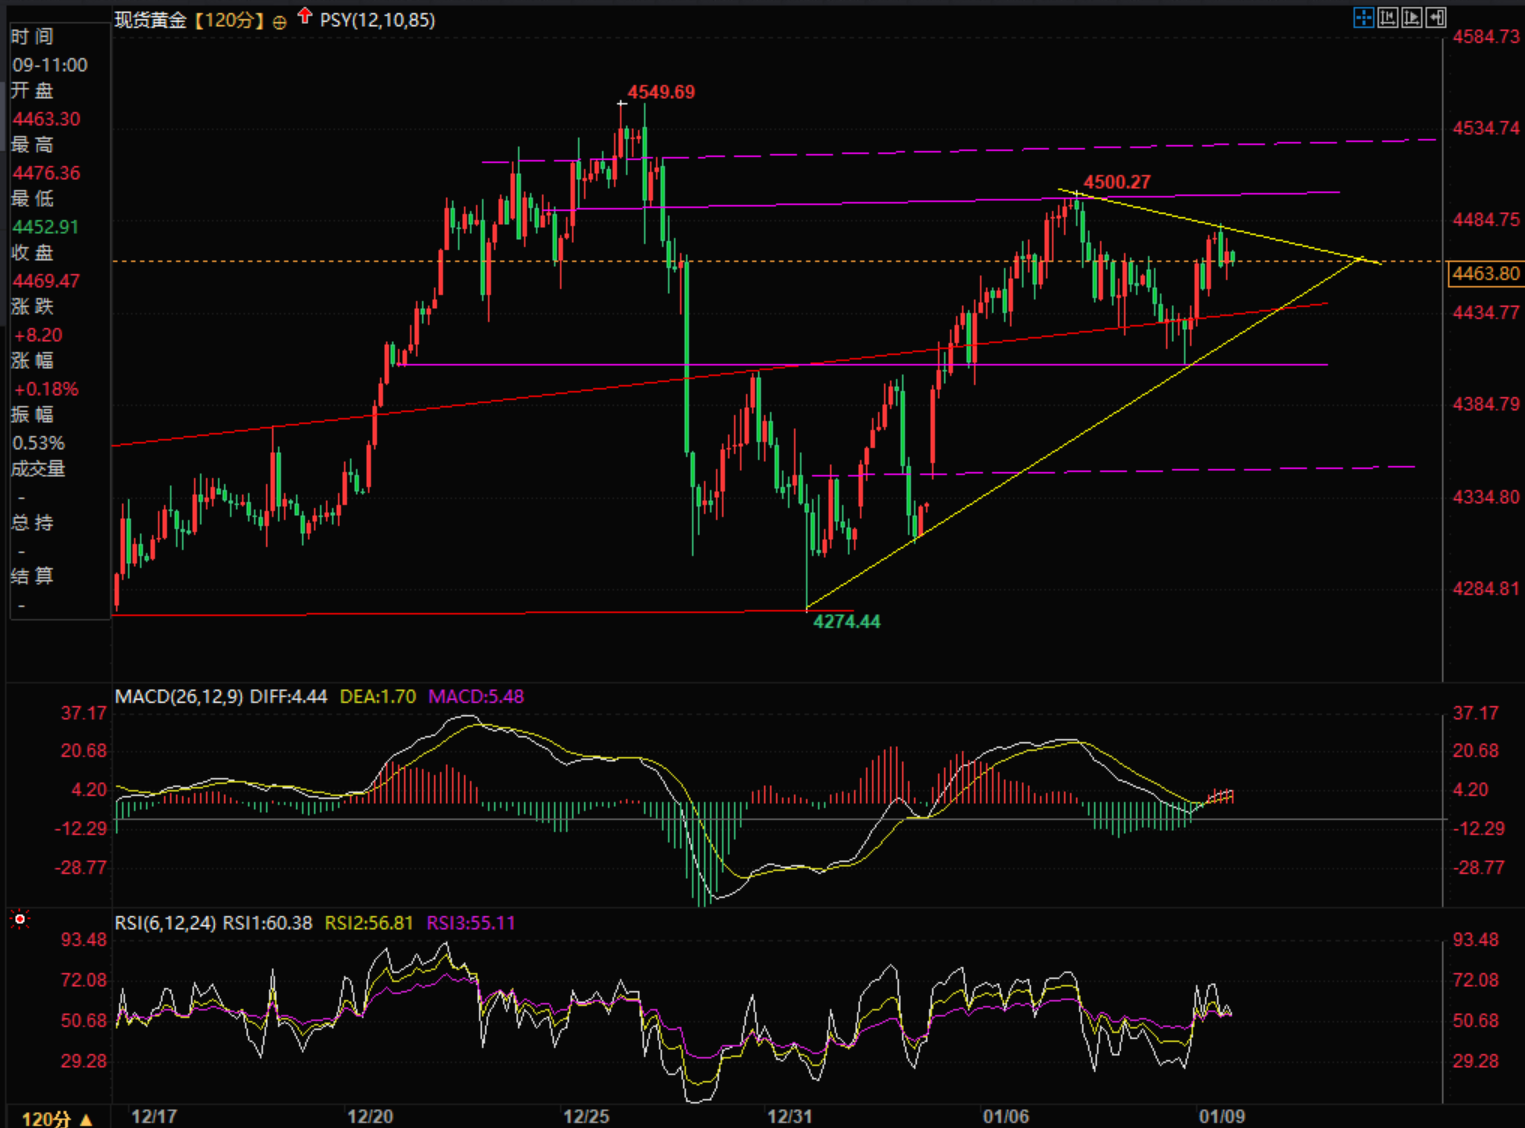
Based on current forward-looking expectations, I believe that if tonight's non-farm payroll data is stronger than 65,000, it will create new short-term bearish factors for gold prices. Initial support is expected in the 4407-4400 area. If the data is higher than 100,000, it may push gold prices to test the 4350 level. If the data is lower than 50,000, it is expected to push gold prices higher in the short term, with resistance levels at 4500 and 4525 respectively.
This article is an original analysis by FX678 analyst Xiruo, and all rights are reserved. It is for reference only and should not be used as a basis for trading.
Figure 1 shows what's touted as a "Smarter" forecast for non-farm payrolls: an increase of 63,700, potentially suggesting a stronger-than-expected non-farm payrolls figure. However, as shown in Figure 5, the latest "leading indicators" for non-farm payrolls are generally mixed.
(For a detailed analysis of the impact on gold prices, plus two charts showing technical analysis of gold prices, see the bottom of this article.)
The charts in this article show the expected data of each institution, as well as the expected mean, mode, maximum, minimum, and prediction intervals for three confidence levels calculated based on the survey results. See the table below for details.
As shown in Figure 1 above, there are 20 institutions/experts who have given expected values for all three indicators.
As shown in Figure 2 above, there are 36 institutions/experts that only provide expected values for two indicators, and 2 institutions/experts that only provide expected values for one indicator (Source: FX678 Special Chart).
[Figure 3 below shows the expected ranges corresponding to confidence levels of 68.2%, 95.5%, and 99.7% for non-farm payrolls, unemployment rate, and annual wage rate, based on the principle of normal distribution.]
[Figure 4 below: Overview of institutional expectations for non-farm payroll changes :]
[Figure 5 below: A summary of institutional expectations for the unemployment rate :]
[Figure 6 below: Overview of various institutions' expectations for annual salary rates :]
[Figure 7 below shows the details of tonight's non-farm payrolls report and its sub-items on the economic calendar page :]
[Figure 8 below shows the latest US "Non-Farm Leading Indicators" released from December 16 to January 8. The overall picture is mixed, suggesting that the US job market may be lukewarm (see FX678 Non-Farm Payrolls Special Report for more details).]
It's important to note that even the most authoritative institutions can make inaccurate predictions. There have been instances where non-farm payroll results were stronger than the strongest expectations, and instances where the released figures were weaker than any institution's forecast. However, market investors base their strategies on these predictions, and the market's reaction is influenced by these expected values, affecting both bullish and bearish adjustments and market sentiment. Therefore, studying the predicted values in advance remains crucial.
Below is a simple analysis of gold.
As shown in Figure 9 below, the gold price is currently moving neatly along the Bollinger Bands on the 2-hour chart. When the price reaches the upper, middle, or lower bands, pay attention to whether it encounters resistance or support. You can also refer to the 15-minute or 30-minute charts for further analysis.
As shown in Figure 10 below, the gold price is currently focused on the triangle area formed by the yellow diagonal line. If it breaks through, then focus on the area formed by the two pink solid lines. If it breaks through again, then focus on the corresponding pink dashed lines.
Based on current forward-looking expectations, I believe that if tonight's non-farm payroll data is stronger than 65,000, it will create new short-term bearish factors for gold prices. Initial support is expected in the 4407-4400 area. If the data is higher than 100,000, it may push gold prices to test the 4350 level. If the data is lower than 50,000, it is expected to push gold prices higher in the short term, with resistance levels at 4500 and 4525 respectively.
This article is an original analysis by FX678 analyst Xiruo, and all rights are reserved. It is for reference only and should not be used as a basis for trading.
- Risk Warning and Disclaimer
- The market involves risk, and trading may not be suitable for all investors. This article is for reference only and does not constitute personal investment advice, nor does it take into account certain users’ specific investment objectives, financial situation, or other needs. Any investment decisions made based on this information are at your own risk.