Non-Farm Payrolls Preview: 68 Indicators Reveal the US Job Market, with a 0.73 Bullish/Bearish Ratio for Gold.
2026-01-09 16:25:21
One chart: 27 out of 68 US employment-related indicators are bullish for gold. The latest US non-farm payroll data will be released on January 9, 2026 at 21:30, and the market is paying close attention. The US non-farm payroll data, considered an essential indicator for financial markets, will likely impact the market. The answer will be revealed tonight. This original chart may offer a glimpse into the future.
The table shows 27 bullish indicators and 37 bearish indicators for gold, with 4 having a neutral impact, based on the latest non-farm payroll and related indicators compared to the previous value. The number of bearish indicators exceeds the number of bullish indicators, indicating an overall bearish trend. There are 27 bullish indicators for gold (bullish/bearish ratio 0.73). Regarding crude oil, theoretically, US indicators that are bullish for gold are bearish for oil prices. A note from Xiruo: When the market reacts to data such as US non-farm payroll, oil prices typically move in the opposite direction to the US dollar briefly (the so-called market knee-jerk reaction), but crude oil quickly recovers and moves in the same direction as the US dollar index (which can be understood as a reaction to the strength of fundamentals).
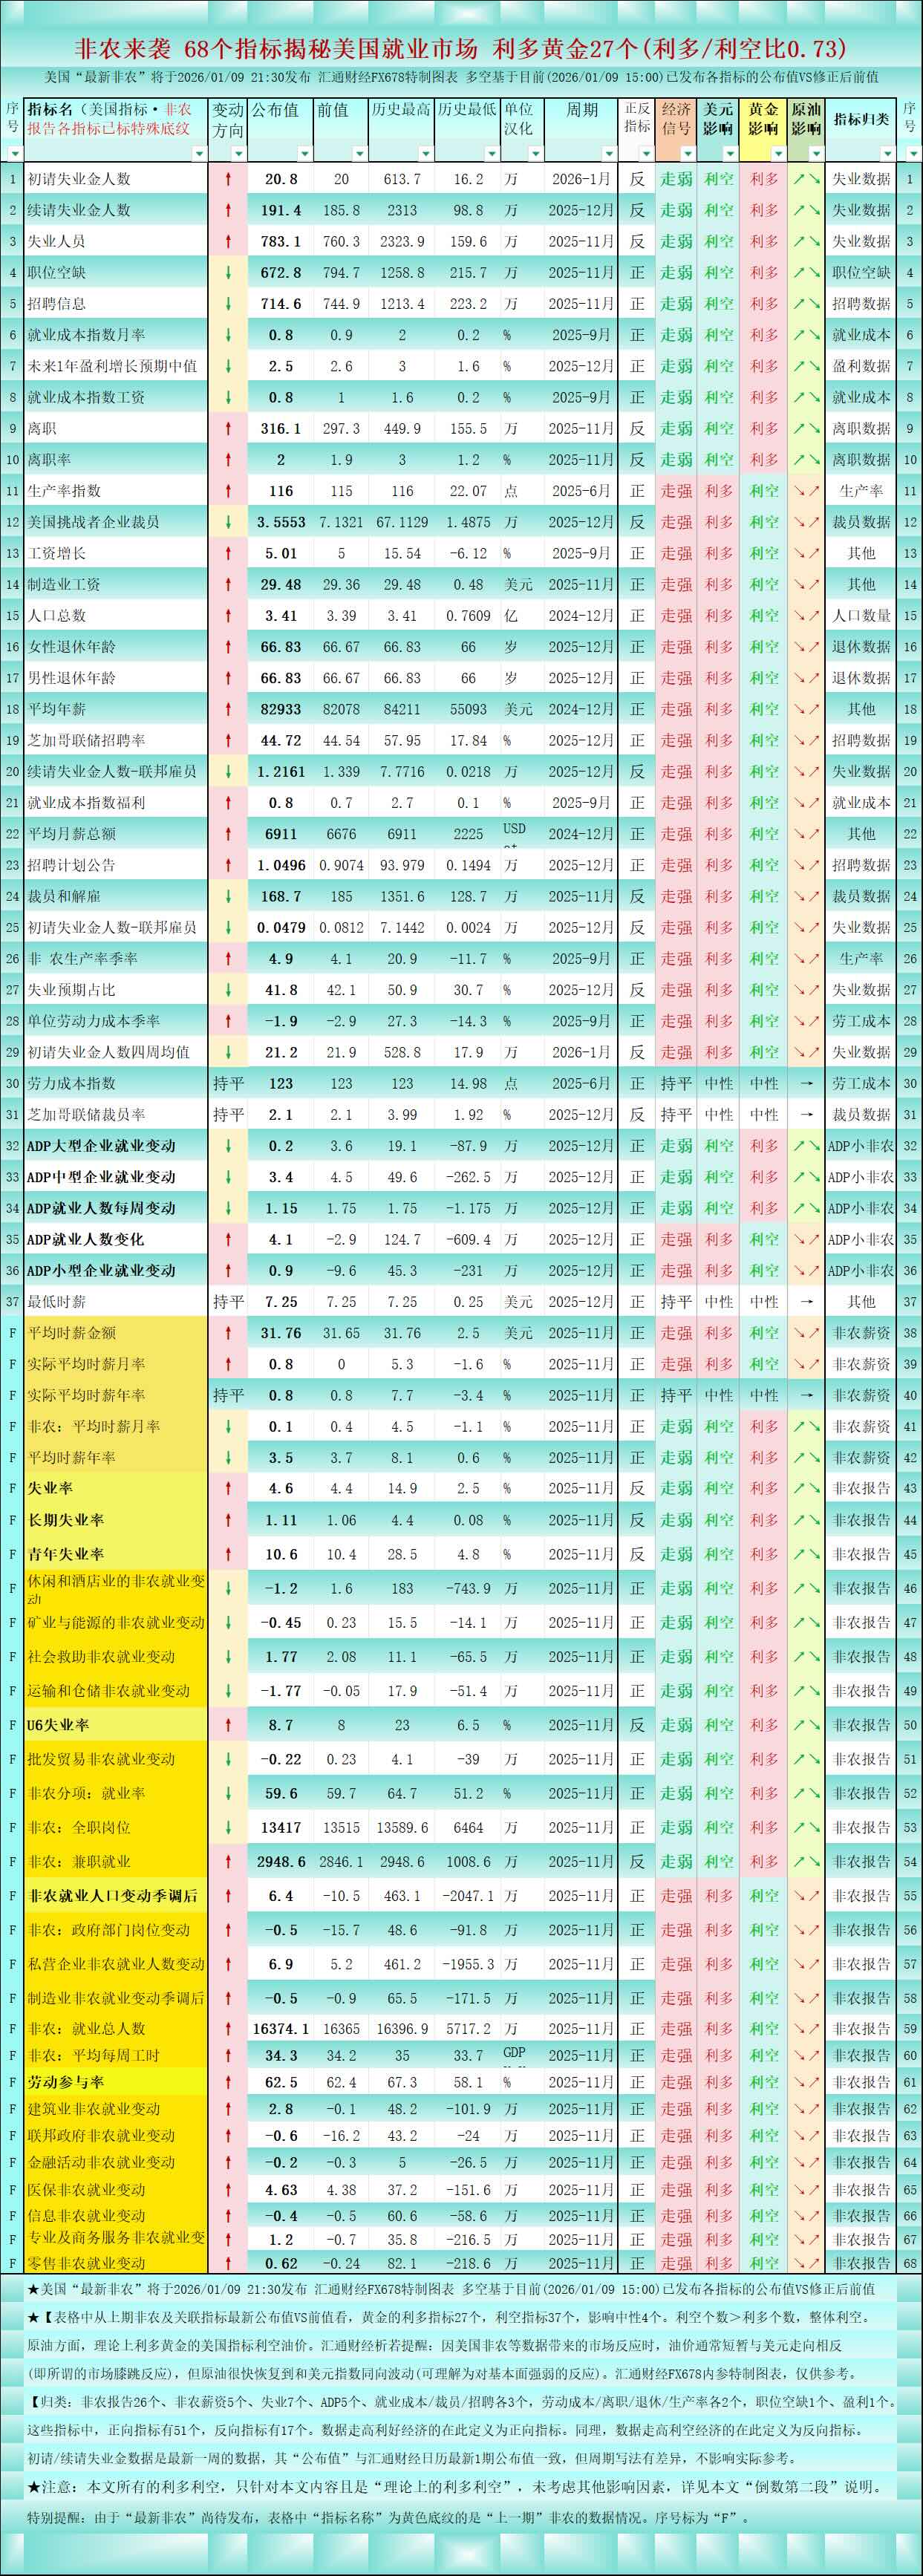
[Above chart: 68 indicators reveal the US job market as non-farm payrolls are released, 27 of which are bullish for gold (bullish/bearish ratio 0.73). Source: FX678 special chart.]
This chart is based on the comparison between the previous US non-farm payrolls report and the previous value, which is currently available (as of 15:00 on January 9, 2026).
[Categorization: 26 non-farm payroll reports, 5 non-farm payroll reports, 7 unemployment reports, 5 ADP reports, 3 each of employment costs/layoffs/hiring, 2 each of labor costs/turnovers/retirement/productivity, 1 job opening, and 1 profit report.]
★Of these indicators, 51 are positive and 17 are negative. Positive indicators are those that indicate positive economic growth, while negative indicators are those that indicate negative economic growth. [Two comparison charts are attached below.]
[The following is a chart showing the trend of "US Non-Farm Payrolls Change" over the past six years, including both released and expected values. Source: FX678 Calendar Indicator Page.]

[Note: All bullish and bearish factors mentioned in this article refer only to the 68 US employment indicators shown in the chart, without considering other influencing factors. Furthermore, these are all "theoretical bullish and bearish factors," and actual market movements may contradict the theory. For example, a classic case of "bad news turning into good news" or "good news turning into bad news" can occur, resulting in a situation where a theoretically positive event actually leads to a price drop, and vice versa. Another example: if a certain commodity is technically in a downtrend, positive factors may cause the price to surge, but after the surge, concentrated selling pressure may cause a deeper drop.]
However, studying "theoretical bullish and bearish factors" can serve as an important reference for advance planning or analyzing trading decisions. How to use this reference specifically will depend on the trading environment formed by other factors, the trader's own trading strategy, and mindset.
This article is an original production of FX678 and is copyrighted. It is for reference only and should not be used as a basis for trading.
The table shows 27 bullish indicators and 37 bearish indicators for gold, with 4 having a neutral impact, based on the latest non-farm payroll and related indicators compared to the previous value. The number of bearish indicators exceeds the number of bullish indicators, indicating an overall bearish trend. There are 27 bullish indicators for gold (bullish/bearish ratio 0.73). Regarding crude oil, theoretically, US indicators that are bullish for gold are bearish for oil prices. A note from Xiruo: When the market reacts to data such as US non-farm payroll, oil prices typically move in the opposite direction to the US dollar briefly (the so-called market knee-jerk reaction), but crude oil quickly recovers and moves in the same direction as the US dollar index (which can be understood as a reaction to the strength of fundamentals).
[Above chart: 68 indicators reveal the US job market as non-farm payrolls are released, 27 of which are bullish for gold (bullish/bearish ratio 0.73). Source: FX678 special chart.]
This chart is based on the comparison between the previous US non-farm payrolls report and the previous value, which is currently available (as of 15:00 on January 9, 2026).
[Categorization: 26 non-farm payroll reports, 5 non-farm payroll reports, 7 unemployment reports, 5 ADP reports, 3 each of employment costs/layoffs/hiring, 2 each of labor costs/turnovers/retirement/productivity, 1 job opening, and 1 profit report.]
★Of these indicators, 51 are positive and 17 are negative. Positive indicators are those that indicate positive economic growth, while negative indicators are those that indicate negative economic growth. [Two comparison charts are attached below.]
[The following is a chart showing the trend of "US Non-Farm Payrolls Change" over the past six years, including both released and expected values. Source: FX678 Calendar Indicator Page.]
[Note: All bullish and bearish factors mentioned in this article refer only to the 68 US employment indicators shown in the chart, without considering other influencing factors. Furthermore, these are all "theoretical bullish and bearish factors," and actual market movements may contradict the theory. For example, a classic case of "bad news turning into good news" or "good news turning into bad news" can occur, resulting in a situation where a theoretically positive event actually leads to a price drop, and vice versa. Another example: if a certain commodity is technically in a downtrend, positive factors may cause the price to surge, but after the surge, concentrated selling pressure may cause a deeper drop.]
However, studying "theoretical bullish and bearish factors" can serve as an important reference for advance planning or analyzing trading decisions. How to use this reference specifically will depend on the trading environment formed by other factors, the trader's own trading strategy, and mindset.
This article is an original production of FX678 and is copyrighted. It is for reference only and should not be used as a basis for trading.
- Risk Warning and Disclaimer
- The market involves risk, and trading may not be suitable for all investors. This article is for reference only and does not constitute personal investment advice, nor does it take into account certain users’ specific investment objectives, financial situation, or other needs. Any investment decisions made based on this information are at your own risk.