Gold prices hit a record high before the rally slowed as profit-taking and geopolitical tensions prevailed.
2026-01-17 00:50:05
Gold prices fell during the US trading session on Friday (January 17), with some traders reducing their positions after gold prices had risen 7.4% since the beginning of the year. While safe-haven demand and expectations of Federal Reserve rate cuts have supported the market throughout 2025, this year's surge in gold prices stems from a sudden geopolitical event in Iran—an event that even prompted President Trump to threaten military action.

At 00:43 Beijing time, spot gold was trading at $4,597.05, down $18.68, or 0.40%.
Gold prices hit a record high of $4,642.97 after concerns about Iran eased, limiting further gains.
Gold prices hit a record high of $4,642.97 on Wednesday before gains stalled as Trump downplayed expectations of a military strike against Iran. Nevertheless, expectations of interest rate cuts and safe-haven buying continued to provide strong support for the market.
Strategic crossroads: Chasing the rise or waiting to buy on dips?
Gold prices previously surged too rapidly, giving bulls a reason to take profits. Investors now face two strategic choices: chase the rally after breaking historical highs, or wait for prices to fall back to their intrinsic value range before buying. Ultimately, this depends on individual investment preferences. However, I've observed that long-term bulls tend to favor a more conservative approach, while short-term traders dominate short-term rallies and market volatility. This pattern is expected to continue as long as the overall upward trend remains intact.
Economic data supports expectations of a Federal Reserve rate cut in 2026.
Economic data also influenced the gold market this week. Tuesday's US consumer inflation data confirmed market expectations of one to two Fed rate cuts this year, opening up upside potential for gold bulls. While a January rate cut is unlikely, traders have already priced in at least two rate cuts between March and December 2026. Thursday's better-than-expected initial jobless claims data weakened market bets on an earlier rate cut, but this news did not completely rule out the possibility of a rate cut this year.
Geopolitical tensions continue to provide support, but are unlikely to sustain the current high levels.
While tensions in Iran have eased somewhat, they haven't completely subsided, and the geopolitical context continues to support gold prices—although the current high price level has weakened this support. This suggests that traders may be waiting for a price pullback before re-entering the market.
Technical Analysis: The upward trend remains intact; key price levels are the focus.
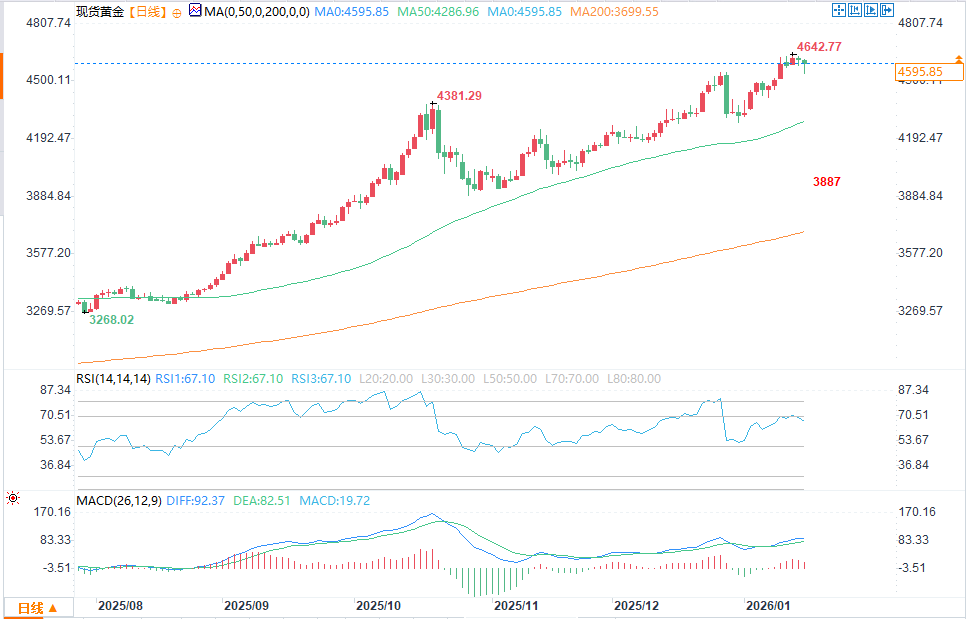
(Spot gold daily chart source: FX678)
From a daily chart perspective, the main trend for gold remains upward. A break above $4642.97 would signal a resumption of the uptrend; a drop below $4407.83 would shift the secondary trend to downward; and a breach of $4274.02 could potentially reverse the main trend to a downward one.
The 50-day moving average is at $4287.02, which is both an effective trend indicator and an important support level.
The current gold price rally started at $3,886.46 on October 28, 2025, and rose to a historical high of $4,642.97. Its 50% retracement level is at $4,264.71. This price level, together with the main support level of $4,274.02 and the 50-day moving average of $4,287.02, forms a support zone.
In the short term, the 50% retracement levels of $4,525.40 and $4,458.49 are key target ranges that may attract buying interest.
Short-term outlook: Uncertainty surrounding the situation in Iran dominated Friday's closing performance.
Gold prices may remain firm before the close due to concerns about a potential escalation of tensions in Iran, with a new wave of buying potentially pushing prices to challenge the historical high of $4,642.97. However, if traders believe that geopolitical risks have significantly decreased, profit-taking could pressure gold prices back into the $4,525.40-$4,458.49 range.
At 00:43 Beijing time, spot gold was trading at $4,597.05, down $18.68, or 0.40%.
Gold prices hit a record high of $4,642.97 after concerns about Iran eased, limiting further gains.
Gold prices hit a record high of $4,642.97 on Wednesday before gains stalled as Trump downplayed expectations of a military strike against Iran. Nevertheless, expectations of interest rate cuts and safe-haven buying continued to provide strong support for the market.
Strategic crossroads: Chasing the rise or waiting to buy on dips?
Gold prices previously surged too rapidly, giving bulls a reason to take profits. Investors now face two strategic choices: chase the rally after breaking historical highs, or wait for prices to fall back to their intrinsic value range before buying. Ultimately, this depends on individual investment preferences. However, I've observed that long-term bulls tend to favor a more conservative approach, while short-term traders dominate short-term rallies and market volatility. This pattern is expected to continue as long as the overall upward trend remains intact.
Economic data supports expectations of a Federal Reserve rate cut in 2026.
Economic data also influenced the gold market this week. Tuesday's US consumer inflation data confirmed market expectations of one to two Fed rate cuts this year, opening up upside potential for gold bulls. While a January rate cut is unlikely, traders have already priced in at least two rate cuts between March and December 2026. Thursday's better-than-expected initial jobless claims data weakened market bets on an earlier rate cut, but this news did not completely rule out the possibility of a rate cut this year.
Geopolitical tensions continue to provide support, but are unlikely to sustain the current high levels.
While tensions in Iran have eased somewhat, they haven't completely subsided, and the geopolitical context continues to support gold prices—although the current high price level has weakened this support. This suggests that traders may be waiting for a price pullback before re-entering the market.
Technical Analysis: The upward trend remains intact; key price levels are the focus.
(Spot gold daily chart source: FX678)
From a daily chart perspective, the main trend for gold remains upward. A break above $4642.97 would signal a resumption of the uptrend; a drop below $4407.83 would shift the secondary trend to downward; and a breach of $4274.02 could potentially reverse the main trend to a downward one.
The 50-day moving average is at $4287.02, which is both an effective trend indicator and an important support level.
The current gold price rally started at $3,886.46 on October 28, 2025, and rose to a historical high of $4,642.97. Its 50% retracement level is at $4,264.71. This price level, together with the main support level of $4,274.02 and the 50-day moving average of $4,287.02, forms a support zone.
In the short term, the 50% retracement levels of $4,525.40 and $4,458.49 are key target ranges that may attract buying interest.
Short-term outlook: Uncertainty surrounding the situation in Iran dominated Friday's closing performance.
Gold prices may remain firm before the close due to concerns about a potential escalation of tensions in Iran, with a new wave of buying potentially pushing prices to challenge the historical high of $4,642.97. However, if traders believe that geopolitical risks have significantly decreased, profit-taking could pressure gold prices back into the $4,525.40-$4,458.49 range.
- Risk Warning and Disclaimer
- The market involves risk, and trading may not be suitable for all investors. This article is for reference only and does not constitute personal investment advice, nor does it take into account certain users’ specific investment objectives, financial situation, or other needs. Any investment decisions made based on this information are at your own risk.