The pound rebounded after hitting a low; watch for resistance at 1.35.
2026-03-02 11:22:42
The British pound rebounded against the US dollar on Monday (March 2), after falling to around 1.3399 in early trading, a new low since January 23, before recovering to around 1.3450. Technical analysis of the daily chart suggests a continued bearish bias for the pair, as it is trading within a descending channel pattern.
The 14-day Relative Strength Index (RSI), a momentum indicator, is currently at 40 points, continuing to be under bearish pressure, but has not yet reached oversold conditions. This indicates that sellers still dominate, but there has not yet been an extreme situation of panic selling.
The short-term market trend is slightly bearish as spot prices are below the nine-day exponential moving average (EMA) and trending toward the flatter 50-day moving average, indicating that upward momentum is weakening.
Initial support is located in the reversal zone around 1.3350. The area near the 50-day EMA may attract bargain hunters looking to buy at the descending channel around 1.3140, followed by the 10-month low of 1.3010.
On the positive side, current resistance lies at the 9-day EMA, at 1.3504, followed by the 50-day EMA, at 1.3518. A break above these moving averages would improve the uptrend and reveal the boundary of the descending channel above (around 1.3630). A further break above the channel would establish a bullish trend and support a test of 1.3869 against the US dollar, the highest level since September 2021, reached on January 27.
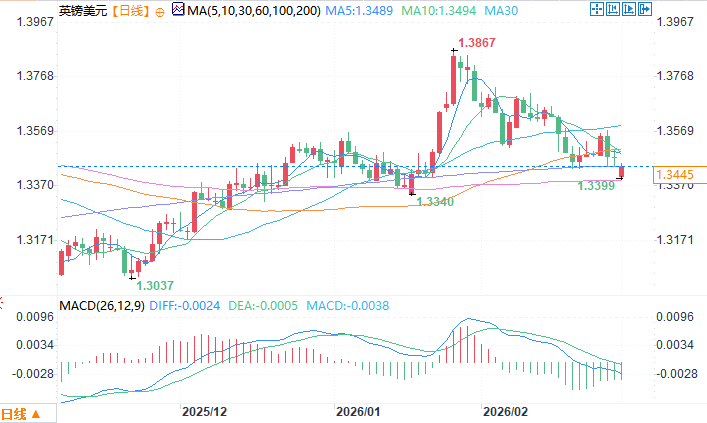
GBP/USD daily chart source: FX678
At 11:22 AM Beijing time on March 2, the British pound was trading at 1.3449/50 against the US dollar.
The 14-day Relative Strength Index (RSI), a momentum indicator, is currently at 40 points, continuing to be under bearish pressure, but has not yet reached oversold conditions. This indicates that sellers still dominate, but there has not yet been an extreme situation of panic selling.
The short-term market trend is slightly bearish as spot prices are below the nine-day exponential moving average (EMA) and trending toward the flatter 50-day moving average, indicating that upward momentum is weakening.
Initial support is located in the reversal zone around 1.3350. The area near the 50-day EMA may attract bargain hunters looking to buy at the descending channel around 1.3140, followed by the 10-month low of 1.3010.
On the positive side, current resistance lies at the 9-day EMA, at 1.3504, followed by the 50-day EMA, at 1.3518. A break above these moving averages would improve the uptrend and reveal the boundary of the descending channel above (around 1.3630). A further break above the channel would establish a bullish trend and support a test of 1.3869 against the US dollar, the highest level since September 2021, reached on January 27.
GBP/USD daily chart source: FX678
At 11:22 AM Beijing time on March 2, the British pound was trading at 1.3449/50 against the US dollar.
- Risk Warning and Disclaimer
- The market involves risk, and trading may not be suitable for all investors. This article is for reference only and does not constitute personal investment advice, nor does it take into account certain users’ specific investment objectives, financial situation, or other needs. Any investment decisions made based on this information are at your own risk.