CPI shakes markets: Dollar hit by mixed signals
2026-04-10 21:33:25
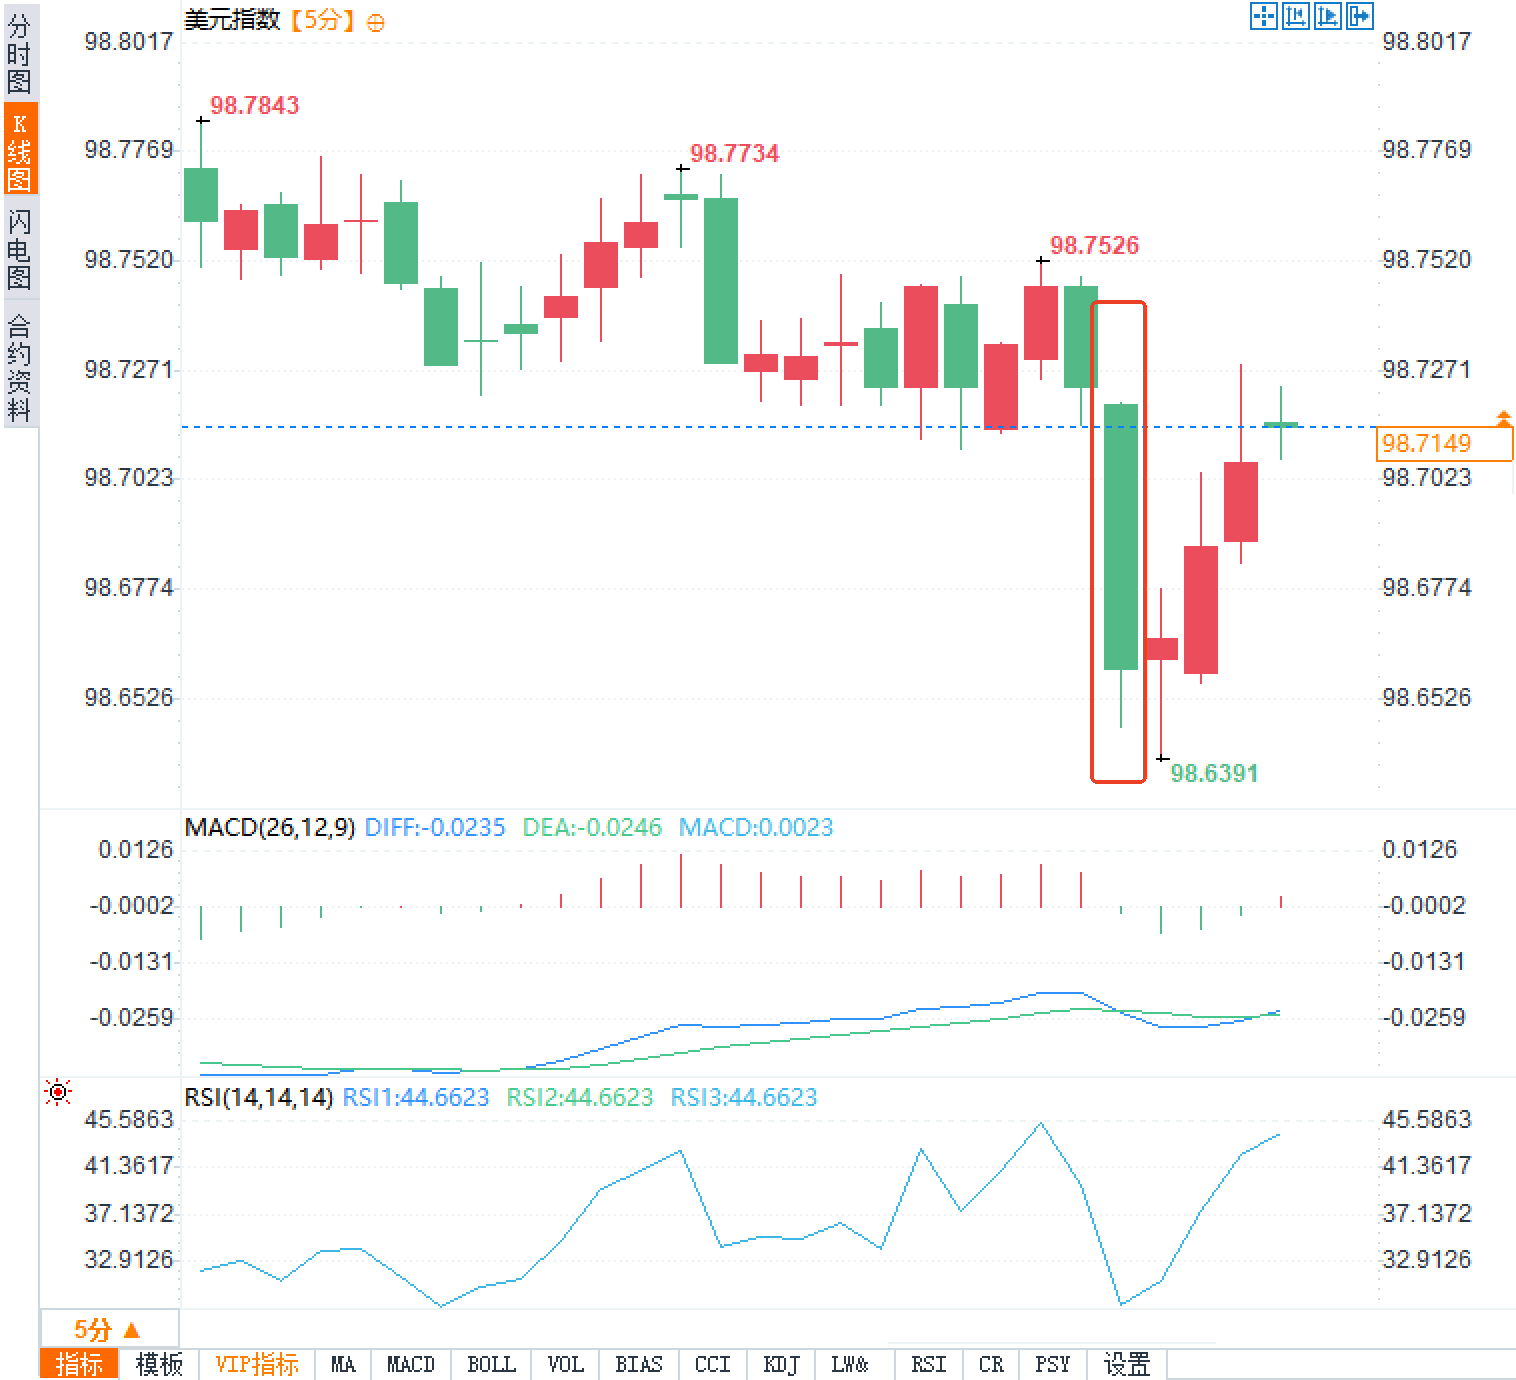
On Friday, April 10th, the US March Consumer Price Index (CPI) data was officially released. The overall CPI rose 3.3% year-on-year, in line with market expectations, but recorded a 0.9% month-on-month increase; the core CPI rose 2.6% year-on-year, lower than the expected 2.7%, and only 0.2% month-on-month. Following the data release, the US dollar index quickly fell by about 10 points and is currently trading around 98.70. This movement directly reflects traders' rapid pricing in of a weaker core indicator: although the energy sub-index was pushed up by external factors, signals of easing underlying inflationary pressures dominated market sentiment, driving adjustments in interest rate expectations.

This report presents a clear structural divergence. The overall index's month-on-month increase was primarily driven by the energy sub-index, which surged 10.9% in a single month. Gasoline prices jumped 21.2%, contributing almost three-quarters of the overall increase for the month. This phenomenon is directly related to recent geopolitical fluctuations, with oil prices being passed on to consumers in the short term. Core CPI rose only 0.2% month-on-month, far below expectations, indicating a significant easing of underlying price pressures excluding food and energy. Housing costs remain the biggest drag, accounting for about one-third of the total, and their lagging nature means official indicators failed to capture the true trend of cooling private sector rents in a timely manner. Service inflation remained sticky overall, with categories such as healthcare, auto insurance, and catering constrained by labor costs and supply, making it difficult to respond quickly to changes in monetary policy. Furthermore, real weekly wages declined by 0.9% month-on-month, further confirming the pressure on consumers' actual purchasing power.
While the supercore inflation indicator exhibits seasonal fluctuations, its overall trend aligns with the core data, highlighting the resilience of non-housing service prices.
The US dollar index fell 10 points quickly after the data release, not simply a negation of the overall expectation, but rather a precise market repricing of policy expectations due to the weaker-than-expected core data. Traders judged that the lower-than-expected core CPI gave the Federal Reserve more room to ignore the short-term energy shock, thus reinforcing the pricing of an easing path this year. Although rising energy prices could theoretically push up overall inflation expectations, the interpretation of a soft landing for core data dominates in the short term, with the dollar's safe-haven appeal temporarily giving way to its growth sensitivity. Intraday volatility briefly increased, reflecting a concentrated release of position adjustments, but the overall trading logic revolved around the framework of dependence on Federal Reserve data.
The Federal Reserve's current federal funds rate range is 3.50%-3.75%. It implemented a 25 basis point rate cut in December and maintained the rate unchanged at its March meeting, continuing its data-dependent stance. The dot plot indicates limited rate cuts in 2026, but the recent softening of core CPI may prompt the market to recalibrate expectations. Inflation, after peaking above 9% in mid-2022, has gradually declined to its current level, and the final push towards the 2% target still faces structural obstacles. The housing lag effect and service stickiness are key resistances. While super-core indicators show signs of gradual easing, labor market dynamics and industry supply bottlenecks complicate the policy normalization process. Fed officials have repeatedly emphasized recently that any upward inflation surprise could delay the pace of easing, and the mixed nature of this report leaves room for subsequent adjustments. Traders need to continuously monitor dot plot updates and official statements to assess the marginal impact of the interest rate path on the dollar index.
The Iranian conflict serves as a backdrop to short-term energy price increases. Historical experience shows that such events often simultaneously drive up overall inflation and threaten economic growth, creating a dilemma for the Federal Reserve's policy decisions. The sharp rise in gasoline prices is already directly reflected in this CPI, but if the conflict eases, a decline in the energy component will further support the downward path of overall inflation, which is beneficial for the medium-term stability of the US dollar. Conversely, if the disturbances persist, safe-haven buying may lead to a temporary rebound in the dollar. When assessing the dollar index, it is necessary to combine energy market dynamics with communication from the Federal Reserve to determine the interaction between fundamentals and risk appetite. Overall, this data reinforces the dollar's sensitive position in balancing inflation and growth; its medium-term direction after the short-term pullback still depends on subsequent data verification and the clarity of policy signals.
March CPI Data Breakdown: Energy-Driven Growth Coexists with Core Slowdown
This report presents a clear structural divergence. The overall index's month-on-month increase was primarily driven by the energy sub-index, which surged 10.9% in a single month. Gasoline prices jumped 21.2%, contributing almost three-quarters of the overall increase for the month. This phenomenon is directly related to recent geopolitical fluctuations, with oil prices being passed on to consumers in the short term. Core CPI rose only 0.2% month-on-month, far below expectations, indicating a significant easing of underlying price pressures excluding food and energy. Housing costs remain the biggest drag, accounting for about one-third of the total, and their lagging nature means official indicators failed to capture the true trend of cooling private sector rents in a timely manner. Service inflation remained sticky overall, with categories such as healthcare, auto insurance, and catering constrained by labor costs and supply, making it difficult to respond quickly to changes in monetary policy. Furthermore, real weekly wages declined by 0.9% month-on-month, further confirming the pressure on consumers' actual purchasing power.
| index | actual value | Expected value | Previous value |
|---|---|---|---|
| Overall CPI year-on-year | 3.3% | 3.3% | 2.5% |
| Overall CPI month-on-month | 0.9% | 0.9% | 0.3% |
| Core CPI year-on-year | 2.6% | 2.7% | 2.5% |
| Core CPI month-on-month | 0.2% | 0.9% | 0.2% |
The immediate reaction logic of the US dollar index
The US dollar index fell 10 points quickly after the data release, not simply a negation of the overall expectation, but rather a precise market repricing of policy expectations due to the weaker-than-expected core data. Traders judged that the lower-than-expected core CPI gave the Federal Reserve more room to ignore the short-term energy shock, thus reinforcing the pricing of an easing path this year. Although rising energy prices could theoretically push up overall inflation expectations, the interpretation of a soft landing for core data dominates in the short term, with the dollar's safe-haven appeal temporarily giving way to its growth sensitivity. Intraday volatility briefly increased, reflecting a concentrated release of position adjustments, but the overall trading logic revolved around the framework of dependence on Federal Reserve data.
Federal Reserve Policy Path and Inflation Target Assessment
The Federal Reserve's current federal funds rate range is 3.50%-3.75%. It implemented a 25 basis point rate cut in December and maintained the rate unchanged at its March meeting, continuing its data-dependent stance. The dot plot indicates limited rate cuts in 2026, but the recent softening of core CPI may prompt the market to recalibrate expectations. Inflation, after peaking above 9% in mid-2022, has gradually declined to its current level, and the final push towards the 2% target still faces structural obstacles. The housing lag effect and service stickiness are key resistances. While super-core indicators show signs of gradual easing, labor market dynamics and industry supply bottlenecks complicate the policy normalization process. Fed officials have repeatedly emphasized recently that any upward inflation surprise could delay the pace of easing, and the mixed nature of this report leaves room for subsequent adjustments. Traders need to continuously monitor dot plot updates and official statements to assess the marginal impact of the interest rate path on the dollar index.
Potential disturbances to the US dollar index from geopolitical factors
The Iranian conflict serves as a backdrop to short-term energy price increases. Historical experience shows that such events often simultaneously drive up overall inflation and threaten economic growth, creating a dilemma for the Federal Reserve's policy decisions. The sharp rise in gasoline prices is already directly reflected in this CPI, but if the conflict eases, a decline in the energy component will further support the downward path of overall inflation, which is beneficial for the medium-term stability of the US dollar. Conversely, if the disturbances persist, safe-haven buying may lead to a temporary rebound in the dollar. When assessing the dollar index, it is necessary to combine energy market dynamics with communication from the Federal Reserve to determine the interaction between fundamentals and risk appetite. Overall, this data reinforces the dollar's sensitive position in balancing inflation and growth; its medium-term direction after the short-term pullback still depends on subsequent data verification and the clarity of policy signals.
Frequently Asked Questions
Question 1: Why did the US dollar index fall despite the overall CPI meeting expectations?
A: Core CPI rose 2.6% year-on-year, lower than the expected 2.7%, and significantly lower than the expected month-on-month figure, indicating a marked easing of underlying inflationary pressures excluding energy. The market believes the Federal Reserve can maintain or accelerate its easing path, and the expected decline in interest rates directly weighs on the US dollar. While the energy shock boosted overall prices, traders are more inclined to focus on core trends to drive pricing.
Question 2: Will the energy shock from the conflict with Iran change the Federal Reserve's policy expectations?
A: Rising energy prices can simultaneously increase inflation and drag down growth, creating a policy dilemma. The recent surge in gasoline prices has already been reflected in the data, but if the conflict eases, a decline in energy prices will benefit inflation control. The Federal Reserve emphasizes data dependence, and the current softening of core monetary policy allows for a certain degree of tolerance. The dollar's reaction reflects the market's assessment of this balance. Going forward, it is necessary to monitor the dynamic interaction between energy prices and the Federal Reserve's communication.
- Risk Warning and Disclaimer
- The market involves risk, and trading may not be suitable for all investors. This article is for reference only and does not constitute personal investment advice, nor does it take into account certain users’ specific investment objectives, financial situation, or other needs. Any investment decisions made based on this information are at your own risk.