


Gold Technical Analysis, May 4: Downward Trend Continues but Momentum is Moderate
2026-05-04 22:00:09
The current daily chart for spot gold shows a clear pattern. Since reaching a new high of 5419.01, the price has been in a slow downward channel. The core characteristics are very obvious: the highs and lows of the rebounds are constantly decreasing, and the price is oscillating downward within the channel. The downtrend is continuous but relatively mild, and there has been no sharp drop. The overall pace is controllable.

During this slow downward trend, the 50-day and 200-day moving averages (MA50 and MA200) acted as strong support and resistance levels, becoming key signals for market reversals. This is clearly demonstrated in recent price movements. In mid-March, after a sustained decline, the price touched the MA200 (4282.29), where it found strong support from this long-term moving average and immediately began a rebound, failing to break through further. However, in mid-April, the price rebounded to near the MA50 (4823), where it encountered strong resistance from this medium-term moving average and failed to break through, subsequently initiating a downward trend. The support and resistance effects of these two moving averages are evident, serving as core references for judging short-term market reversals.
From the current price level, although the overall trend is a slow downward movement within a descending channel, the price is still above the channel's central axis. This means that while the short-term bias is bearish, the market is not extremely weak and there's no need to be overly pessimistic. There's no need for excessive panic in the future. The key focus should be on whether the support level holds. As long as the support holds, there's still room for short-term consolidation, and an uncontrolled decline is unlikely.
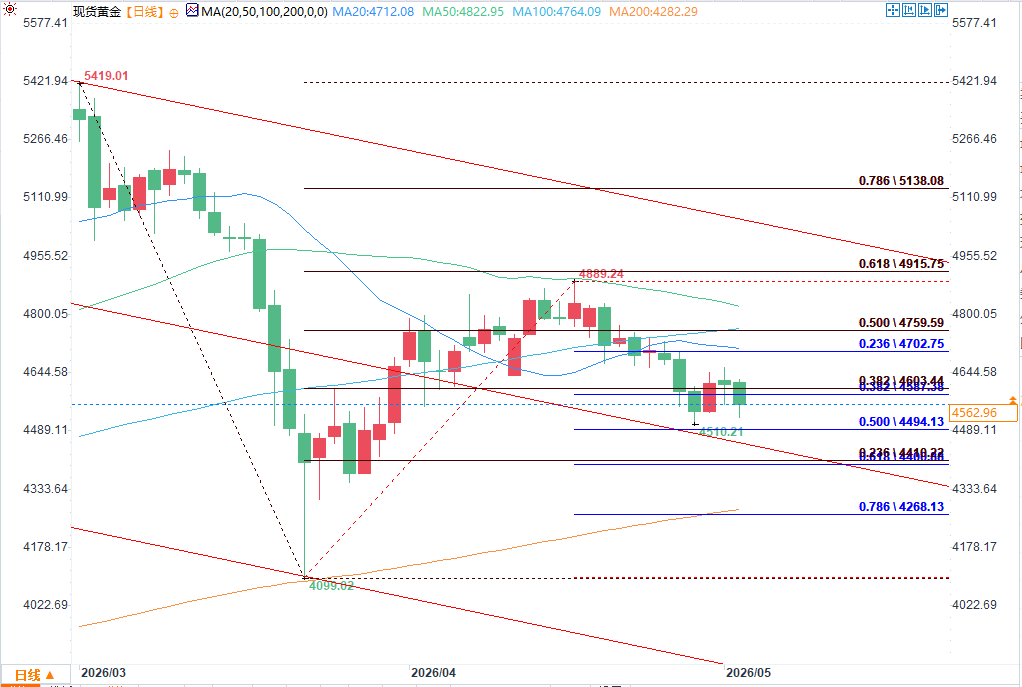
(Spot gold daily chart source: FX678)
Considering both Fibonacci levels and moving average support, the next move will first test the initial support level – the 0.5 Fibonacci level at 4494. This is the primary short-term support level. If this support holds, it can temporarily alleviate downward pressure, and the price is expected to consolidate around this level. If the 0.5 Fibonacci support level is broken, the next test will be the overlapping Fibonacci support range of 4400-4410. If this range is also broken, the support of the 200-day moving average (MA200) (4282.29) will be tested. As a long-term strong support, the MA200 is likely to provide strong support and become an important bottom line for the downtrend.
In terms of resistance, in the short term, the initial resistance is concentrated around the MA20 (4712.08) and the 0.236 Fibonacci level. This position is the first hurdle for the current price rebound. If the price wants to start a rebound in the short term, it needs to break through this resistance range first. Above this resistance, the core resistance is the MA50 (4823). This position successfully suppressed the price rebound in mid-April. The resistance is strong and it is difficult to break through effectively in the short term. Only when the price stabilizes above the MA50 can the bearish pressure be relieved and a phased rebound be ushered in.
To provide some basic background information and better understand the current market situation: The recent delay in the Fed's interest rate cut expectations and the strengthening of the US dollar have put some pressure on the gold rebound, which is also an important reason why the price is struggling to break through the upper resistance. However, at the same time, the continued gold hoarding by global central banks, geopolitical safe-haven demand, and physical gold buying have also provided strong support below, preventing a significant breakdown.
In summary, spot gold is currently in a slow downward channel, with gradually decreasing highs and lows. The 50-day and 200-day moving averages (MA50 and MA200) are providing significant support and resistance. The current price is above the channel's central axis, so there's no need for excessive pessimism. The key focus going forward is on the 4400-4410 Fibonacci support zone and the effectiveness of the MA200. On the resistance side, key levels to watch are the MA20, the 0.236 Fibonacci level, and the strong resistance at the MA50 (4823). In terms of trading strategy, it is recommended to focus on signals from moving averages and key Fibonacci levels, following the trend and waiting for clear breakout signals from support or resistance levels, while strictly controlling risk.
At 21:45 Beijing time, spot gold was trading at $4,566.06 per ounce, down 1.08%.
During this slow downward trend, the 50-day and 200-day moving averages (MA50 and MA200) acted as strong support and resistance levels, becoming key signals for market reversals. This is clearly demonstrated in recent price movements. In mid-March, after a sustained decline, the price touched the MA200 (4282.29), where it found strong support from this long-term moving average and immediately began a rebound, failing to break through further. However, in mid-April, the price rebounded to near the MA50 (4823), where it encountered strong resistance from this medium-term moving average and failed to break through, subsequently initiating a downward trend. The support and resistance effects of these two moving averages are evident, serving as core references for judging short-term market reversals.
From the current price level, although the overall trend is a slow downward movement within a descending channel, the price is still above the channel's central axis. This means that while the short-term bias is bearish, the market is not extremely weak and there's no need to be overly pessimistic. There's no need for excessive panic in the future. The key focus should be on whether the support level holds. As long as the support holds, there's still room for short-term consolidation, and an uncontrolled decline is unlikely.
(Spot gold daily chart source: FX678)
Considering both Fibonacci levels and moving average support, the next move will first test the initial support level – the 0.5 Fibonacci level at 4494. This is the primary short-term support level. If this support holds, it can temporarily alleviate downward pressure, and the price is expected to consolidate around this level. If the 0.5 Fibonacci support level is broken, the next test will be the overlapping Fibonacci support range of 4400-4410. If this range is also broken, the support of the 200-day moving average (MA200) (4282.29) will be tested. As a long-term strong support, the MA200 is likely to provide strong support and become an important bottom line for the downtrend.
In terms of resistance, in the short term, the initial resistance is concentrated around the MA20 (4712.08) and the 0.236 Fibonacci level. This position is the first hurdle for the current price rebound. If the price wants to start a rebound in the short term, it needs to break through this resistance range first. Above this resistance, the core resistance is the MA50 (4823). This position successfully suppressed the price rebound in mid-April. The resistance is strong and it is difficult to break through effectively in the short term. Only when the price stabilizes above the MA50 can the bearish pressure be relieved and a phased rebound be ushered in.
To provide some basic background information and better understand the current market situation: The recent delay in the Fed's interest rate cut expectations and the strengthening of the US dollar have put some pressure on the gold rebound, which is also an important reason why the price is struggling to break through the upper resistance. However, at the same time, the continued gold hoarding by global central banks, geopolitical safe-haven demand, and physical gold buying have also provided strong support below, preventing a significant breakdown.
In summary, spot gold is currently in a slow downward channel, with gradually decreasing highs and lows. The 50-day and 200-day moving averages (MA50 and MA200) are providing significant support and resistance. The current price is above the channel's central axis, so there's no need for excessive pessimism. The key focus going forward is on the 4400-4410 Fibonacci support zone and the effectiveness of the MA200. On the resistance side, key levels to watch are the MA20, the 0.236 Fibonacci level, and the strong resistance at the MA50 (4823). In terms of trading strategy, it is recommended to focus on signals from moving averages and key Fibonacci levels, following the trend and waiting for clear breakout signals from support or resistance levels, while strictly controlling risk.
At 21:45 Beijing time, spot gold was trading at $4,566.06 per ounce, down 1.08%.
- Risk Warning and Disclaimer
- The market involves risk, and trading may not be suitable for all investors. This article is for reference only and does not constitute personal investment advice, nor does it take into account certain users’ specific investment objectives, financial situation, or other needs. Any investment decisions made based on this information are at your own risk.
