The key lifeline for the US dollar that major players are watching: a break above it threatens gold, while a break below it stabilizes crude oil.
2026-06-04 20:44:46
On Thursday (June 4), the US dollar index consolidated near 99.23, gold prices fluctuated around $4490/ounce, and crude oil was under pressure near $92.66. The three showed some correlation and divergence: the dollar maintained a slightly bullish trend, gold showed signs of a short-term rebound within its downward channel, and crude oil continued its weak and volatile trend due to supply and demand factors. Over the past few days, changes in the Middle East geopolitical situation have disrupted risk sentiment and energy prices, while policy expectations of major economies continue to influence the relative strength of the dollar and gold. Data shows that although gold has formed a golden cross at a low level, the rebound is limited; crude oil shows a clear trend of progressively lower highs; and the dollar faces a directional choice near its middle band. In the short term, the convergence of fundamental news and technical indicators will determine the next movement of these three assets.

The current market's core drivers remain the interplay of geopolitical factors and macroeconomic policy expectations. Reports from major overseas institutions indicate that developments in the Middle East are directly impacting crude oil supply and demand expectations. With supply disruption concerns easing temporarily, the risk premium for oil prices has declined, which aligns with crude oil's current trading below the Bollinger Band middle line at 93.72. Meanwhile, the US dollar, as a safe-haven and interest rate-sensitive asset, is exerting significant downward pressure on gold: the dollar index has rebounded from its May low of 97.6182 to a high near 99.56, and although momentum is weakening, it remains within the upper Bollinger Band region. This relatively strong dollar environment limits gold's upside potential, despite gold's own demand for inflation hedging. Data shows that the correlation between crude oil and the dollar is relatively low, with crude oil being more driven by its own inventory and production dynamics. The negative correlation between gold and the dollar remains significant in the current window, and any move by the dollar above 99.59 could further test gold's support level.
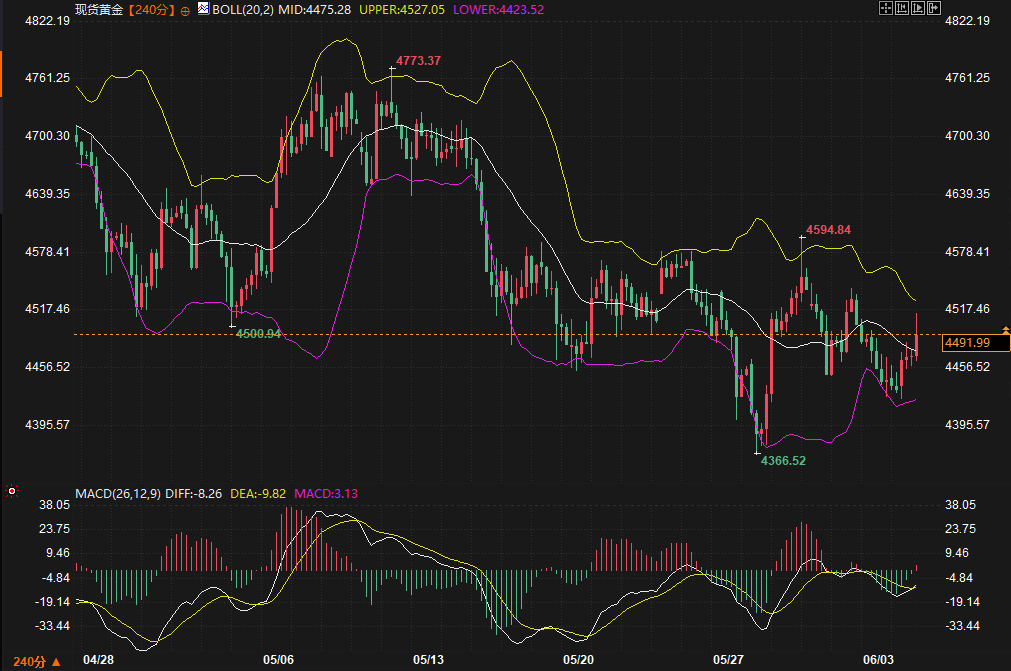
From a 4-hour chart perspective, gold fell from a high of 4773.37 in early May to a low of 4366.52 at the end of May, briefly rebounded to 4594.84 in early June, and then fell back to around 4491.99. The price is currently above the Bollinger Middle Band at 4475.28, but still within the lower half of the Bollinger Bands, indicating that the rebound has not yet been fully confirmed. The MACD indicator shows a golden cross with the DIFF crossing above the DEA, and the histogram has turned positive at 3.13, suggesting a weakening of short-term bearish momentum. Logically, if the price can effectively hold above the 4475-4490 range, accompanied by strong trading volume, it may test the upper Bollinger Band at 4527.05 and the previous rebound high of 4594.84; conversely, if it fails to hold the lower Bollinger Band support at 4423.52, it may return to the lows around 4366.52 to find a bottom. The combination of fundamental and technical factors suggests that gold is currently in a recovery phase within a downtrend, with external dollar pressure and its own rebound signals jointly shaping a possible path of upward correction amid fluctuations.
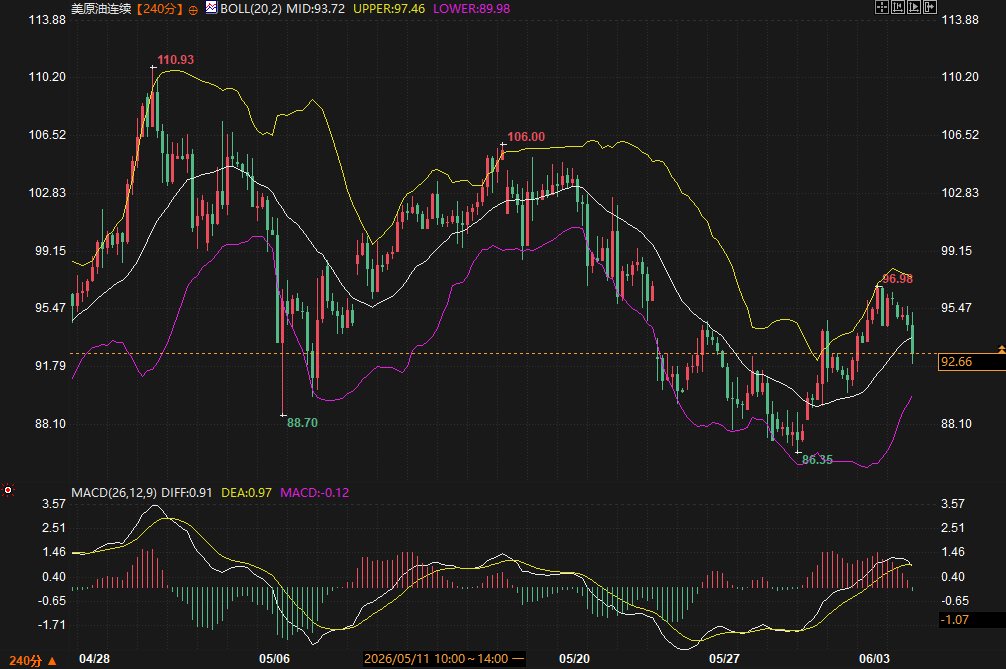
The 4-hour chart for crude oil shows a clear pattern of progressively lower highs: from 110.93 at the end of April to 106.00 in mid-May, and then to 96.98 in early June, maintaining an overall wide-range downward trend. The current price of 92.66 is below the Bollinger Middle Band at 93.72, trading weakly between the middle and lower bands. The MACD is in a death cross state, with the DIFF below the DEA and the histogram negative, indicating that bearish momentum still dominates. Key support lies at the lower Bollinger Band at 89.98 and the previous low of 86.35; a decisive break below these levels could exacerbate downward pressure. The first resistance level is the 93.72 middle band; a break above this level would allow further observation of the 97.46 upper band and the 96.98 high. From a fundamental perspective, supply dynamics and demand expectations are at play: if geopolitical factors do not escalate significantly, the loose inventory environment will continue to suppress prices, corroborating the death cross signal on the technical chart. Data shows that crude oil will likely remain weak and volatile in the short term; attention should be paid to whether it can recover the middle band to change the current weak structure.
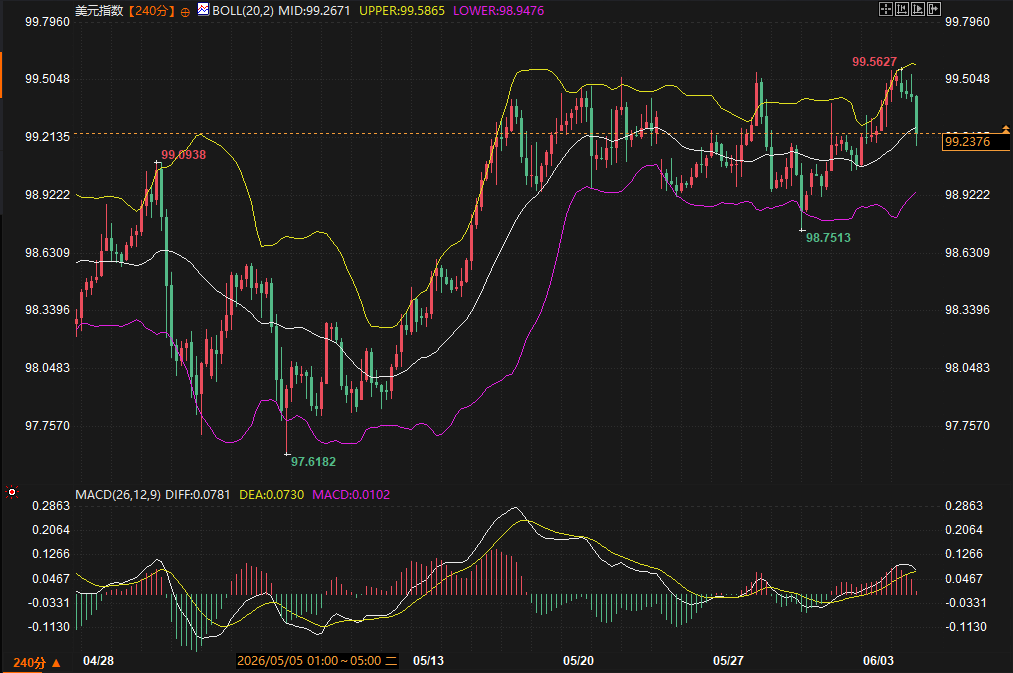
The US dollar index, on the 4-hour chart, has been trending upwards since its May low of 97.6182. Recently, it encountered resistance near 99.56 and retreated to 99.2376, closely following the Bollinger Middle Band at 99.2671, indicating a narrowing trading range. The MACD golden cross is present, but the histogram is only at 0.0102, suggesting limited bullish momentum and a period of directional uncertainty. Strong resistance lies at the upper Bollinger Band at 99.5865 and the previous high of 99.5627, while support is at the lower Bollinger Band at 98.9476 and the 98.75 area. From a cross-market perspective, the strength of the US dollar directly impacts gold valuations: if the dollar holds above the middle Bollinger Band and breaks above 99.59, it will open up further upside potential while simultaneously exerting additional downward pressure on gold; conversely, a pullback below 98.95 could alleviate pressure on gold and provide some risk aversion buffer for crude oil. This interplay suggests that the dollar's "directional choice" will be one of the core variables in market volatility over the next 2-3 days.
Based on both fundamental and technical factors, the market is expected to remain range-bound for the next 2-3 days, but structural divergence warrants attention. The US dollar index is likely to continue hovering around its middle band of 99.2671, with its direction depending on macroeconomic data and risk sentiment, whether it tests 99.59 upwards or falls back to test 98.95. Gold, supported by the MACD golden cross, is expected to maintain its oscillating rebound. If it stabilizes above the 4475-4490 range, it will likely correct towards the 4527-4594 range in the short term; otherwise, it still faces the risk of testing the lower band. Crude oil, pressured by the death cross, is expected to continue its weak oscillation within the 89.98-93.72 range; a breakout of either boundary will amplify volatility. The overall logic is consistent: easing geopolitical tensions and stable policy expectations will support the current oscillating pattern, while any unexpected news could disrupt the balance. Investors need to continuously monitor the effectiveness of key ranges, as market volatility remains high.
Is the current rebound in gold reliable, and can it be sustained?
Data shows that the 4-hour MACD golden cross at a low level does indicate a temporary weakening of bearish momentum, but the price remains within the overall downward channel and is still some distance from the upper Bollinger Band. Logically, the sustainability of the rebound depends on whether it can effectively hold above the middle Bollinger Band around 4475. If the US dollar strengthens in tandem, the rebound's potential will be significantly limited, and a short-term correction is more likely than a trend reversal.
How effective is the support level for crude oil? What would happen if it broke down?
The lower Bollinger Band at 89.98 and the previous low of 86.35 form a key support zone. Given the ongoing bearish crossover in the technical charts, a break below 89.98 could trigger a further decline to the 86 area, at which point the signals of easing supply and demand would be reinforced. Conversely, a quick recovery above the middle Bollinger Band at 93.72 could alleviate the short-term weakness.
How will the directional choice of the US dollar index affect other asset classes?
As a benchmark asset, the US dollar's movements have a strong negative correlation with gold. If the dollar breaks through the 99.59 resistance level, the upward pressure on gold will increase; conversely, a pullback could provide gold with some breathing room. Crude oil is affected by the dollar relatively indirectly, but changes in overall risk sentiment will still have a ripple effect through the financial markets.
What are the main aspects of the current linkage between the three major commodities?
Gold exhibits the most significant negative correlation with the US dollar, while crude oil's price movement is relatively independent, driven by supply and demand as well as geopolitical factors. In the current window, the direction of the US dollar becomes crucial in influencing gold's price movement, while crude oil largely follows its own technical patterns; the three have not yet formed a highly synchronized resonance.
What indicators and ranges should we focus on observing in the next 2-3 days?
Key levels to watch are the validity of the 99.2671 mid-level for the US dollar, the struggle within the 4475-4527 range for gold, and the resistance test at 93.72 for crude oil. Meanwhile, geopolitical developments and major economic data reported by leading overseas institutions will provide fundamental validation. Any breakout from a range should be analyzed by observing changes in trading volume and the MACD histogram to determine its validity.
Fundamental Environment and Cross-Market Transmission
The current market's core drivers remain the interplay of geopolitical factors and macroeconomic policy expectations. Reports from major overseas institutions indicate that developments in the Middle East are directly impacting crude oil supply and demand expectations. With supply disruption concerns easing temporarily, the risk premium for oil prices has declined, which aligns with crude oil's current trading below the Bollinger Band middle line at 93.72. Meanwhile, the US dollar, as a safe-haven and interest rate-sensitive asset, is exerting significant downward pressure on gold: the dollar index has rebounded from its May low of 97.6182 to a high near 99.56, and although momentum is weakening, it remains within the upper Bollinger Band region. This relatively strong dollar environment limits gold's upside potential, despite gold's own demand for inflation hedging. Data shows that the correlation between crude oil and the dollar is relatively low, with crude oil being more driven by its own inventory and production dynamics. The negative correlation between gold and the dollar remains significant in the current window, and any move by the dollar above 99.59 could further test gold's support level.
Gold Technical Patterns and Key Ranges
From a 4-hour chart perspective, gold fell from a high of 4773.37 in early May to a low of 4366.52 at the end of May, briefly rebounded to 4594.84 in early June, and then fell back to around 4491.99. The price is currently above the Bollinger Middle Band at 4475.28, but still within the lower half of the Bollinger Bands, indicating that the rebound has not yet been fully confirmed. The MACD indicator shows a golden cross with the DIFF crossing above the DEA, and the histogram has turned positive at 3.13, suggesting a weakening of short-term bearish momentum. Logically, if the price can effectively hold above the 4475-4490 range, accompanied by strong trading volume, it may test the upper Bollinger Band at 4527.05 and the previous rebound high of 4594.84; conversely, if it fails to hold the lower Bollinger Band support at 4423.52, it may return to the lows around 4366.52 to find a bottom. The combination of fundamental and technical factors suggests that gold is currently in a recovery phase within a downtrend, with external dollar pressure and its own rebound signals jointly shaping a possible path of upward correction amid fluctuations.
Crude oil supply and demand dynamics and trend suppression
The 4-hour chart for crude oil shows a clear pattern of progressively lower highs: from 110.93 at the end of April to 106.00 in mid-May, and then to 96.98 in early June, maintaining an overall wide-range downward trend. The current price of 92.66 is below the Bollinger Middle Band at 93.72, trading weakly between the middle and lower bands. The MACD is in a death cross state, with the DIFF below the DEA and the histogram negative, indicating that bearish momentum still dominates. Key support lies at the lower Bollinger Band at 89.98 and the previous low of 86.35; a decisive break below these levels could exacerbate downward pressure. The first resistance level is the 93.72 middle band; a break above this level would allow further observation of the 97.46 upper band and the 96.98 high. From a fundamental perspective, supply dynamics and demand expectations are at play: if geopolitical factors do not escalate significantly, the loose inventory environment will continue to suppress prices, corroborating the death cross signal on the technical chart. Data shows that crude oil will likely remain weak and volatile in the short term; attention should be paid to whether it can recover the middle band to change the current weak structure.
US Dollar Direction and Related Effects
The US dollar index, on the 4-hour chart, has been trending upwards since its May low of 97.6182. Recently, it encountered resistance near 99.56 and retreated to 99.2376, closely following the Bollinger Middle Band at 99.2671, indicating a narrowing trading range. The MACD golden cross is present, but the histogram is only at 0.0102, suggesting limited bullish momentum and a period of directional uncertainty. Strong resistance lies at the upper Bollinger Band at 99.5865 and the previous high of 99.5627, while support is at the lower Bollinger Band at 98.9476 and the 98.75 area. From a cross-market perspective, the strength of the US dollar directly impacts gold valuations: if the dollar holds above the middle Bollinger Band and breaks above 99.59, it will open up further upside potential while simultaneously exerting additional downward pressure on gold; conversely, a pullback below 98.95 could alleviate pressure on gold and provide some risk aversion buffer for crude oil. This interplay suggests that the dollar's "directional choice" will be one of the core variables in market volatility over the next 2-3 days.
Trend Outlook
Based on both fundamental and technical factors, the market is expected to remain range-bound for the next 2-3 days, but structural divergence warrants attention. The US dollar index is likely to continue hovering around its middle band of 99.2671, with its direction depending on macroeconomic data and risk sentiment, whether it tests 99.59 upwards or falls back to test 98.95. Gold, supported by the MACD golden cross, is expected to maintain its oscillating rebound. If it stabilizes above the 4475-4490 range, it will likely correct towards the 4527-4594 range in the short term; otherwise, it still faces the risk of testing the lower band. Crude oil, pressured by the death cross, is expected to continue its weak oscillation within the 89.98-93.72 range; a breakout of either boundary will amplify volatility. The overall logic is consistent: easing geopolitical tensions and stable policy expectations will support the current oscillating pattern, while any unexpected news could disrupt the balance. Investors need to continuously monitor the effectiveness of key ranges, as market volatility remains high.
Frequently Asked Questions
Is the current rebound in gold reliable, and can it be sustained?
Data shows that the 4-hour MACD golden cross at a low level does indicate a temporary weakening of bearish momentum, but the price remains within the overall downward channel and is still some distance from the upper Bollinger Band. Logically, the sustainability of the rebound depends on whether it can effectively hold above the middle Bollinger Band around 4475. If the US dollar strengthens in tandem, the rebound's potential will be significantly limited, and a short-term correction is more likely than a trend reversal.
How effective is the support level for crude oil? What would happen if it broke down?
The lower Bollinger Band at 89.98 and the previous low of 86.35 form a key support zone. Given the ongoing bearish crossover in the technical charts, a break below 89.98 could trigger a further decline to the 86 area, at which point the signals of easing supply and demand would be reinforced. Conversely, a quick recovery above the middle Bollinger Band at 93.72 could alleviate the short-term weakness.
How will the directional choice of the US dollar index affect other asset classes?
As a benchmark asset, the US dollar's movements have a strong negative correlation with gold. If the dollar breaks through the 99.59 resistance level, the upward pressure on gold will increase; conversely, a pullback could provide gold with some breathing room. Crude oil is affected by the dollar relatively indirectly, but changes in overall risk sentiment will still have a ripple effect through the financial markets.
What are the main aspects of the current linkage between the three major commodities?
Gold exhibits the most significant negative correlation with the US dollar, while crude oil's price movement is relatively independent, driven by supply and demand as well as geopolitical factors. In the current window, the direction of the US dollar becomes crucial in influencing gold's price movement, while crude oil largely follows its own technical patterns; the three have not yet formed a highly synchronized resonance.
What indicators and ranges should we focus on observing in the next 2-3 days?
Key levels to watch are the validity of the 99.2671 mid-level for the US dollar, the struggle within the 4475-4527 range for gold, and the resistance test at 93.72 for crude oil. Meanwhile, geopolitical developments and major economic data reported by leading overseas institutions will provide fundamental validation. Any breakout from a range should be analyzed by observing changes in trading volume and the MACD histogram to determine its validity.
- Risk Warning and Disclaimer
- The market involves risk, and trading may not be suitable for all investors. This article is for reference only and does not constitute personal investment advice, nor does it take into account certain users’ specific investment objectives, financial situation, or other needs. Any investment decisions made based on this information are at your own risk.