As geopolitical tensions ease, WTI crude oil prices retreated after an initial surge.
2026-06-09 01:48:30
On Monday (June 8), during the US trading session, West Texas Intermediate (WTI) crude oil traded around $90.93 per barrel, up 0.43%. As geopolitical tensions in the Middle East eased, the gains in crude oil prices narrowed.
Earlier that day, renewed tensions between Israel and Iran sent crude oil prices soaring. The Iranian-backed Houthi rebels announced attacks on Israel and banned Israeli ships from the Red Sea; meanwhile, a new round of mutual strikes between Israel and Iran sparked market concerns about an escalation of regional conflict.
An Iranian Foreign Ministry spokesman stated that the ceasefire agreement has been repeatedly violated and warned that the latest developments will further undermine the Iran-US peace process. Furthermore, Iranian Parliament Speaker Mohammad Bagher Ghalibaf warned that US and allied military bases in the region could become "legitimate targets," further exacerbating market concerns about risks to global energy supplies.
Amid escalating tensions, the Strait of Hormuz remains a key focus for investors. A significant portion of global oil exports rely on this strategic waterway, and markets continue to assess the potential impact of a prolonged disruption.
Meanwhile, the Organization of the Petroleum Exporting Countries (OPEC+) announced that it would increase crude oil production by 188,000 barrels per day starting in July. However, the market believes that this increase is relatively conservative.
However, Iran's Fars News Agency reported that the Iranian armed forces announced the end of their military operation against Israel, causing most of the previous gains in oil prices to recede. The report noted that Tehran warned that Iran would retaliate more severely if Israel attacked Lebanon again, but this claim has not yet been confirmed by other media outlets.
Previously, US President Trump called on Israel and Iran to immediately cease hostilities. Following this news, WTI crude oil prices fell sharply from their intraday high of around $93.50 per barrel, as investors reassessed the immediate risk of widespread disruptions to regional energy supplies.
Bob Savage, an analyst at BNY Mellon, believes that the balance between conflict-related risks and the gradual increase in new supply will dominate short-term oil price movements. Analysts at Danske Bank also point out that the recent rise in oil prices reflects a market reassessment of regional supply risks. The bank believes that following the latest military clashes between Israel and Iran, market hopes for a broader agreement and a restoration of stable energy flows have been dashed.
Looking ahead, Societe Generale believes the oil market may still be underestimating potential supply pressures. The bank points out that with global crude oil inventories continuing to decline, restoring a sustainable balance in the energy market may ultimately require higher oil prices.
Technical Analysis
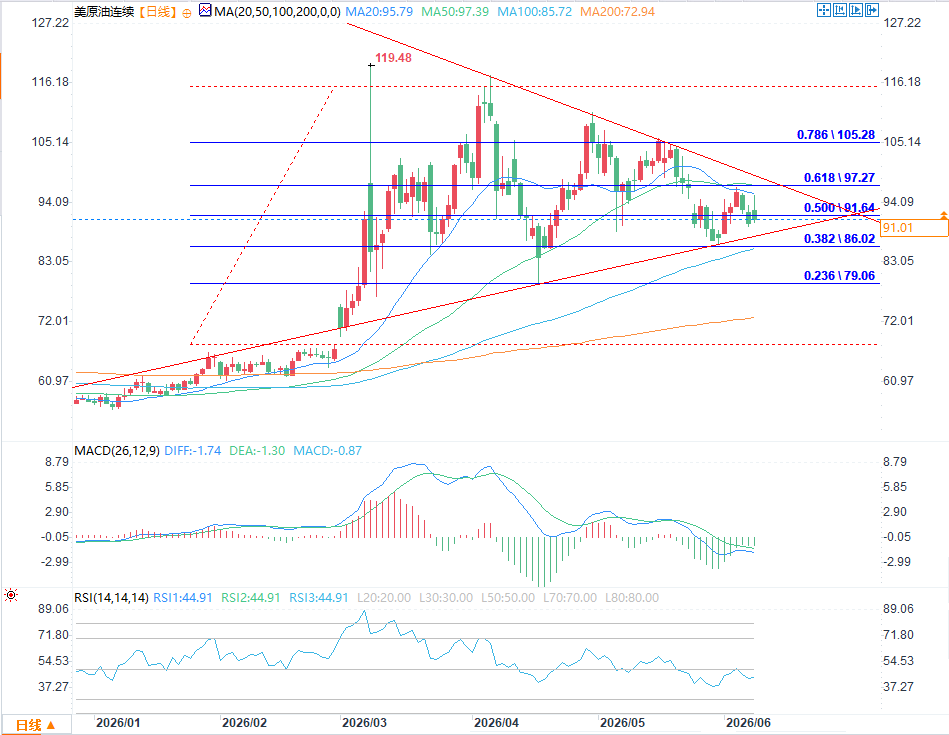
(WTI crude oil daily chart source: FX678)
From the daily chart, US crude oil is currently at a critical juncture where multiple technical signals are converging. The core analysis is as follows:
The price recently tested the 20-day moving average (around 95.79) and fell back under pressure. It has broken below the 50% Fibonacci retracement level of the previous upward wave (91.64), and after touching a low of around 90 US dollars, it formed a candlestick with a long lower shadow, indicating that there is some buying support at this level. However, the rebound is weak and it has not yet regained the 50% retracement level.
The price is currently in a converging triangle consolidation pattern, suppressed by the downtrend line extending from the previous high (119.48) above and supported by the uptrend line extending from the low of December 2025 (54.98) below. The fluctuation range continues to narrow, and the current price is located in the lower part of the triangle, showing an overall weak and volatile pattern.
MACD: The DIFF line (-1.74) and DEA line (-1.30) formed a death cross below the zero axis. The histogram is negative. Although the bearish momentum has weakened, it has not completely reversed. The bearish signal is still present.
RSI: The current value is 44.91, which is in the lower part of the neutral range. It has not entered the oversold range and lacks a clear trend signal, which further confirms the oscillating pattern.
Without significant fundamental stimulus, oil prices are likely to continue their narrow range trading within the triangle pattern. In the short term, two key levels to watch are: resistance at 91.64-92.87 (50% Fibonacci retracement + previous consolidation level) and support at 86.02 (38.2% Fibonacci retracement + upward trendline). If prices break below $86, the lower triangle support will fail, potentially opening up further downside potential; conversely, a rebound above $92 could lead to a challenge of the upper triangle resistance.
Earlier that day, renewed tensions between Israel and Iran sent crude oil prices soaring. The Iranian-backed Houthi rebels announced attacks on Israel and banned Israeli ships from the Red Sea; meanwhile, a new round of mutual strikes between Israel and Iran sparked market concerns about an escalation of regional conflict.
An Iranian Foreign Ministry spokesman stated that the ceasefire agreement has been repeatedly violated and warned that the latest developments will further undermine the Iran-US peace process. Furthermore, Iranian Parliament Speaker Mohammad Bagher Ghalibaf warned that US and allied military bases in the region could become "legitimate targets," further exacerbating market concerns about risks to global energy supplies.
Amid escalating tensions, the Strait of Hormuz remains a key focus for investors. A significant portion of global oil exports rely on this strategic waterway, and markets continue to assess the potential impact of a prolonged disruption.
Meanwhile, the Organization of the Petroleum Exporting Countries (OPEC+) announced that it would increase crude oil production by 188,000 barrels per day starting in July. However, the market believes that this increase is relatively conservative.
However, Iran's Fars News Agency reported that the Iranian armed forces announced the end of their military operation against Israel, causing most of the previous gains in oil prices to recede. The report noted that Tehran warned that Iran would retaliate more severely if Israel attacked Lebanon again, but this claim has not yet been confirmed by other media outlets.
Previously, US President Trump called on Israel and Iran to immediately cease hostilities. Following this news, WTI crude oil prices fell sharply from their intraday high of around $93.50 per barrel, as investors reassessed the immediate risk of widespread disruptions to regional energy supplies.
Bob Savage, an analyst at BNY Mellon, believes that the balance between conflict-related risks and the gradual increase in new supply will dominate short-term oil price movements. Analysts at Danske Bank also point out that the recent rise in oil prices reflects a market reassessment of regional supply risks. The bank believes that following the latest military clashes between Israel and Iran, market hopes for a broader agreement and a restoration of stable energy flows have been dashed.
Looking ahead, Societe Generale believes the oil market may still be underestimating potential supply pressures. The bank points out that with global crude oil inventories continuing to decline, restoring a sustainable balance in the energy market may ultimately require higher oil prices.
Technical Analysis
(WTI crude oil daily chart source: FX678)
From the daily chart, US crude oil is currently at a critical juncture where multiple technical signals are converging. The core analysis is as follows:
The price recently tested the 20-day moving average (around 95.79) and fell back under pressure. It has broken below the 50% Fibonacci retracement level of the previous upward wave (91.64), and after touching a low of around 90 US dollars, it formed a candlestick with a long lower shadow, indicating that there is some buying support at this level. However, the rebound is weak and it has not yet regained the 50% retracement level.
The price is currently in a converging triangle consolidation pattern, suppressed by the downtrend line extending from the previous high (119.48) above and supported by the uptrend line extending from the low of December 2025 (54.98) below. The fluctuation range continues to narrow, and the current price is located in the lower part of the triangle, showing an overall weak and volatile pattern.
MACD: The DIFF line (-1.74) and DEA line (-1.30) formed a death cross below the zero axis. The histogram is negative. Although the bearish momentum has weakened, it has not completely reversed. The bearish signal is still present.
RSI: The current value is 44.91, which is in the lower part of the neutral range. It has not entered the oversold range and lacks a clear trend signal, which further confirms the oscillating pattern.
Without significant fundamental stimulus, oil prices are likely to continue their narrow range trading within the triangle pattern. In the short term, two key levels to watch are: resistance at 91.64-92.87 (50% Fibonacci retracement + previous consolidation level) and support at 86.02 (38.2% Fibonacci retracement + upward trendline). If prices break below $86, the lower triangle support will fail, potentially opening up further downside potential; conversely, a rebound above $92 could lead to a challenge of the upper triangle resistance.
- Risk Warning and Disclaimer
- The market involves risk, and trading may not be suitable for all investors. This article is for reference only and does not constitute personal investment advice, nor does it take into account certain users’ specific investment objectives, financial situation, or other needs. Any investment decisions made based on this information are at your own risk.