Investment banks say 4000 points is the bottom, and multiple factors indicate that structural opportunities for gold are emerging.
2026-08-05 18:10:53
The current international gold market is showing significant divergence. In the short term, amid multiple factors including dollar fluctuations, oil price corrections, geopolitical tensions, and expectations surrounding Federal Reserve policy, gold prices have broken out of their recent sideways trading pattern. On Wednesday (August 5th), gold prices surged by 2%, demonstrating a clear short-term rebound. The core driver of this rebound was the sharp decline in overnight US Treasury yields, coupled with market speculation on a potential easing of tensions between the US and Iran. Recent optimistic signals from Trump and Treasury Secretary Bessenter regarding US-Iran peace talks have boosted market risk appetite and fueled the gold price rebound. However, the situation regarding the US-Iran conflict remains uncertain. If there is no clear progress within 48 hours, gold prices may experience a correction. Nevertheless, in the medium to long term, supported by continued gold purchases by global central banks and the diversification of national reserves, gold prices have a solid mid-term bottom and exhibit strong resilience. 
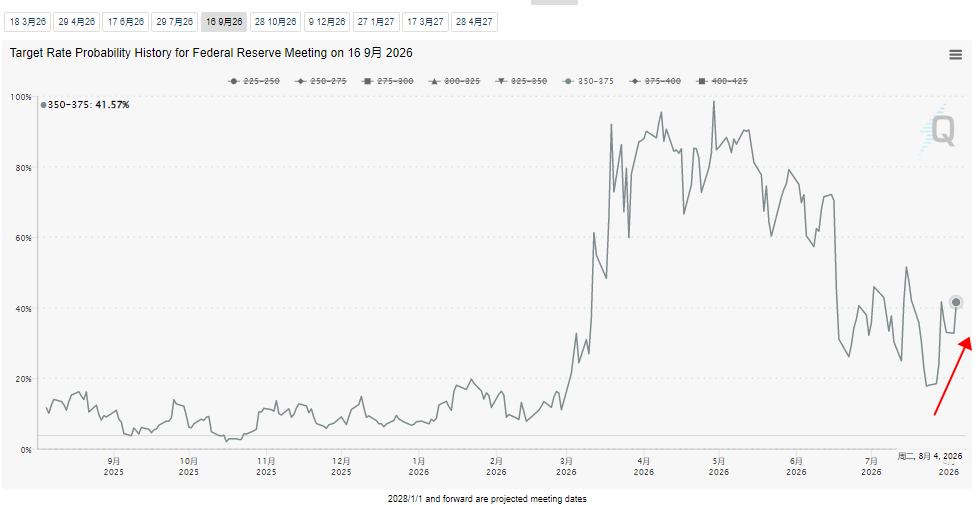 (CME interest rate futures chart, source: CME Group)
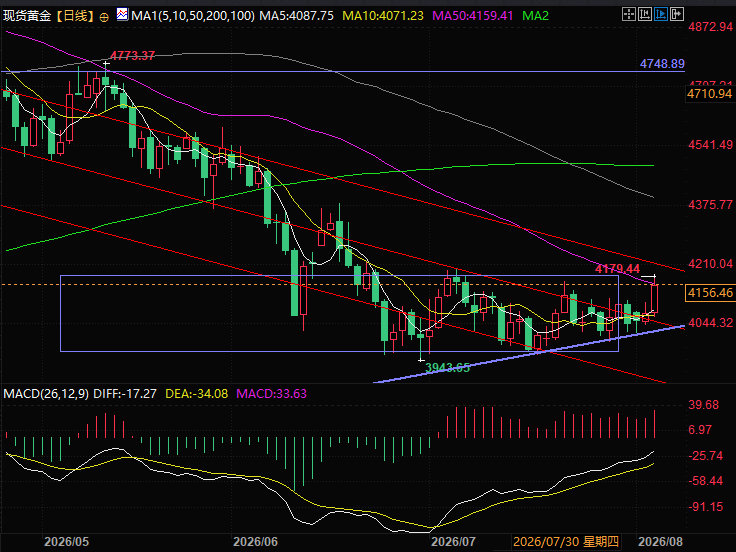 (Spot gold daily chart, source: FX678) At 18:02 Beijing time, spot gold is currently trading at 4153.08.
Short-term market drivers: The combined effects of the US dollar, oil prices, and geopolitical sentiment.
A weaker US dollar index has improved the cost-effectiveness of gold for holders of non-US currencies, providing fundamental support for gold prices. The continued decline in crude oil prices has effectively suppressed market inflation expectations, indirectly alleviating the downward pressure on gold from high interest rates. Geopolitical sentiment has become the core theme for short-term gold pricing, with the market primarily focused on the narrative of US-Iran easing tensions. Trump publicly stated that US-Iran negotiations have made positive progress, and Treasury Secretary Bessenter optimistically predicted that the two sides could reach a rapid air traffic agreement. Although Iran denied these claims, the frequent optimistic signals released by the US have dominated short-term market sentiment, driving down oil prices and causing gold prices to rebound. Meanwhile, the correlation between gold and oil prices remains intact; the inflationary pressure transmitted from oil prices continues to influence the macro market, and geopolitical easing signals will also provide potential upside for gold prices. However, as a non-interest-bearing asset, gold's value is naturally limited in a high-interest-rate environment, and interest rates remain the core negative factor suppressing gold price increases.Federal Reserve Policy Expectations: Rate Hike Expectations Cool, September Decision a Key Turning Point
The Federal Reserve's policy expectations remain the core logic driving short-term gold price movements. Currently, the market is pricing in a rebound in the probability of the September FOMC meeting maintaining interest rates, rising from 21% to 41.1%, which is a short-term positive for gold price recovery. The Fed's decision to keep rates unchanged in July provided a brief respite for gold, but internal policy disagreements persist, with several officials maintaining their stance on rate hikes and adhering to the policy target of reducing inflation to 2%. The policy uncertainty left over from July has been carried over to September. The two inflation data releases before the meeting will be crucial for policy adjustments, making the September decision a key watershed moment for gold price movements in the second half of the year. If a rate hike is implemented, the cost of holding gold will increase, the dollar will strengthen, and gold prices will be under pressure. If rate hike expectations continue to cool, the biggest negative factor for gold will gradually dissipate. Analysts suggest that the pressure on gold prices from high yields, a strong dollar, and weak ETF demand may last longer than the market expects. (CME interest rate futures chart, source: CME Group)Current Market Situation and Breakout Logic: Range Consolidation, Employment Data to Determine Direction
Gold has shown remarkable resilience, defying the impact of hawkish policies and de-escalating geopolitical tensions, but lacks sustained upward momentum. It has been consolidating within a wide trading range of $4,000-$4,200 per ounce for the past month. TD Securities predicts that this range-bound pattern will continue without significant data releases. The market's focus is currently entirely on the US labor market; today's ADP data and Friday's non-farm payroll report are key to breaking the current stalemate. While previous JOLTS job data showed no signs of recession, companies are becoming more cautious with hiring amid a weakening manufacturing sector. The strength of employment data will directly reshape interest rate pricing: weaker data will lower yields and reduce expectations of rate hikes, benefiting gold prices as they approach the $4,500-$4,750 range by the end of the year; conversely, continued strong employment and inflation will boost the dollar and yields, pushing gold prices back to the $4,000 level, where downside risks should not be ignored.A review of central bank gold purchase data: Continued increases throughout the year, with June purchases hitting a new peak.
Global central bank gold purchases have been a core fundamental support for the long-term bull market in gold since 2024, solidifying the long-term trend of reserve diversification. Data from the World Gold Council shows that in June 2026, global central banks increased their gold holdings for the third consecutive month, with net purchases of 51 tons, a peak for the year. In the first half of the year, central banks accumulated net purchases of 102 tons, showing a clear reversal in the market trend. While March saw net sales of 30 tons, purchases increased month-on-month from April to June. By country, Poland, China, Uzbekistan, and Kazakhstan were the main gold buyers. Poland increased its holdings by 19 tons in June, and China by 15 tons. China has been purchasing gold continuously for 20 consecutive months, with several emerging economies such as Jordan and the Czech Republic following suit. On the selling side, Russia and Turkey were the main sellers of gold. Turkey's gold buying and selling volume was basically flat in June, while Russia sold 9 tons that month. In the first half of the year, Turkey sold a total of 83 tons of gold, and Russia sold 44 tons. The former conducted gold swap operations to stabilize the lira and protect foreign exchange reserves, while the latter sold gold to fill fiscal gaps due to geopolitical conflicts, Western sanctions, and asset freezes. After surging to $5,608 per ounce in January this year, gold prices have given back more than 25% of their gains due to geopolitical situations, inflation, and rising US Treasury yields. The short-term trend is volatile, but the core positive factor of continued large-scale gold purchases by global central banks remains unchanged, continuously consolidating the foundation for gold's medium- to long-term upward trend.Institutional Viewpoint:
Regarding the recent gold price trend, several major overseas asset management institutions, including State Street Global Advisors and Aberdeen Asset Management, have reached a general consensus that the area around $4,000/ounce is a temporary bottom in this bull market correction. The current decline is merely a clearing out of speculative funds and consolidation at high levels, not a trend reversal. Based on historical retracement patterns and multi-factor pricing models, the $4,000 level offers a very high safety margin. Driven by multiple catalysts, including medium- to long-term fiscal deficit expansion, continued gold purchases by global central banks, a deglobalization trend providing support, and the Federal Reserve's potential shift in monetary policy, gold prices are expected to return to an upward trend this year and reach new historical highs early next year. Overseas institutions further point out that the downside potential below $4,000 is extremely limited. If US economic data weakens, US Treasury yields fall, and expectations of interest rate cuts rise, gold prices could potentially reach the $4,500-$4,750 range by the end of the year. This deep correction presents excellent buying opportunities for long-term gold investment.Summary and Technical Analysis:
Multiple securities firms and investment banks have begun to believe that 4000 is the recent bottom, or even the medium- to long-term bottom. Previous articles have repeatedly pointed out the possibility of a price reversal at this level. Technically, while spot gold has rebounded, the speed and magnitude of the rebound have been limited, suggesting the market is still in a phase of divergence. If news is favorable, gold prices may gradually strengthen, but it's important to note that if the rebound is weaker than expected, gold prices may still retest the lows. Currently, the main factor is the geopolitical situation between the US and Iran. As mentioned in previous articles, be wary of a potential upward breakout after a period of narrowing price fluctuations. This time, gold prices, combined with fundamental factors, have indeed chosen to break upwards. Currently, they are constrained by the 50-day moving average and the upper edge of the trading range. The next resistance level is the upper rail of the gradually declining descending channel. Support levels are at 4118 and further down at 4069. (Spot gold daily chart, source: FX678) At 18:02 Beijing time, spot gold is currently trading at 4153.08.
- Risk Warning and Disclaimer
- The market involves risk, and trading may not be suitable for all investors. This article is for reference only and does not constitute personal investment advice, nor does it take into account certain users’ specific investment objectives, financial situation, or other needs. Any investment decisions made based on this information are at your own risk.