Gold surges ahead of non-farm payrolls report: many superficial reasons, but the underlying logic is perplexing.
2026-08-06 21:28:52
On Wednesday (August 5), spot gold surged over 4% (approximately $180-$188) in a single day, closing near $4240, and subsequently climbed further to the $4300 mark, marking its largest single-day gain in recent months. This rally occurred before the release of Friday's non-farm payroll data, with the market instantly shifting from a "wait-and-see" stance to a "bullish frenzy." On the surface, the reasons for this rally seem quite compelling: ADP employment data significantly missed expectations, the US dollar index fell below 100, and rising expectations of Middle East negotiations led to a sharp drop in oil prices. However, a deeper examination of the market and macroeconomic logic reveals that these superficial catalysts are insufficient to support such an extreme single-day surge. The underlying driving logic of this rally remains shrouded in mystery and uncertainty.  The Mainstream Market Explanation The current market interpretation of this round of gold price surge mainly focuses on technical breakouts, range selection, position squeezing, and fundamental catalysts—these are also the most widely circulated core logics. Technical Breakout: Key Confirmation of the 50-Day Moving Average and the Downtrend Line This is also the clearest and most convincing explanation for this round of price increases. Since reaching a historical high of $5595 at the end of January, gold has entered a clear downward channel, with prices consistently suppressed by the downtrend line extending from the highs. The 50-day moving average has also consistently acted as a key resistance level. On August 5th, driven by a combination of macroeconomic news, gold prices broke through the confluence of the trend line and the 50-day moving average resistance zone near $4200 and successfully stabilized above it.
 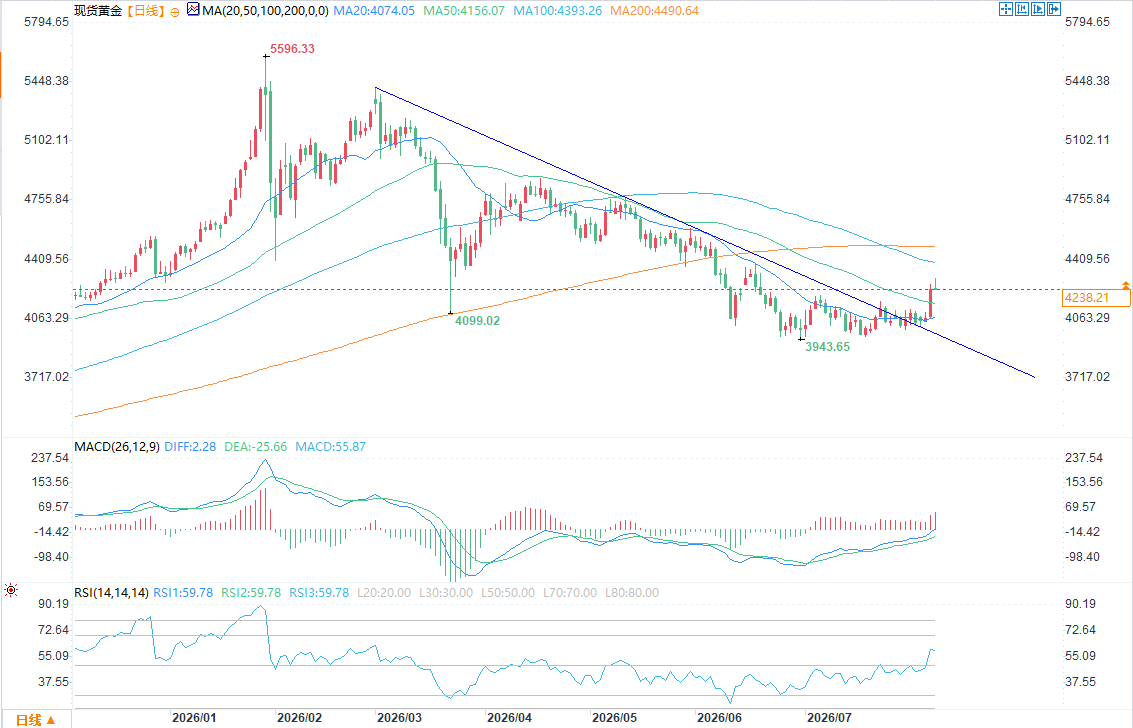 (Spot Gold Daily Chart Source: FX678) This breakout of a key level carries strong technical significance: it completely ended the months-long downtrend structure, breaking the long-term weak pattern; it triggered a trend signal shift in a large number of algorithmic trading systems, with mainstream trend-following models switching to bullish signals; and it attracted concentrated short-term momentum funds, forcing existing short positions to stop-loss and cover. From a technical perspective, the breakout was accompanied by continuously increasing volume and consecutive positive price increases, typical characteristics of a breakout with high volume. Most traders define this effective breakout as a crucial signal that the market is shifting from "consolidation and correction" to "trend reversal." Compared to short-term news stimuli, the fundamental technical structure breakthrough is the core reason why this round of price increases far exceeds normal fluctuations. Directional Choice After Consolidation Looking at a longer timeframe, gold has been consolidating within the $4000-$4200 range for over a month, with a long-term balance between bullish and bearish forces and market observation. The violent surge on August 5th was essentially a definite directional choice after a long period of consolidation. Multiple factors, including positive macroeconomic catalysts and a breakthrough of key technical levels, have completely broken the stalemate within the current range. Capital markets have a long-standing rule that "prolonged consolidation inevitably leads to a direction." The longer the consolidation period, the more capital accumulates, and once a valid breakout occurs, the momentum and strength of the price surge tend to be more intense. This also reasonably explains why the recent gold price increase far exceeded the typical volatility that could be supported by a single fundamental news event. CTA Short Squeeze: Passive Rally Driven by Position Structure This is the most frequently mentioned structural logic in the market and the core of this round of price increases. Over the past few months, gold has fallen more than 24% from its historical high. During this continuous downward trend, CTA trend-following funds have continuously accumulated short positions, keeping market short positions consistently high. When the price effectively broke through the key technical threshold of $4200, algorithmic trading systems triggered a concentrated short-covering order, forcing a massive exit of short positions and creating a typical short squeeze. Multiple institutions have pointed out that this surge was not due to new long positions actively buying in large quantities, but rather a passive price increase driven by concentrated short covering. Currently, long-term institutional bulls have not truly entered the market, and with short sellers exiting en masse, the market has even briefly experienced a buying vacuum. Bloomberg strategist Cameron Crise also stated that, according to traditional macroeconomic driving models, the recent single-day increase in gold prices far exceeded reasonable expectations, representing a rare instance of gold significantly "outperforming the model" in recent years. Short-term fundamental catalysts are concentrated . This round of market movement has a textbook-level convergence of multiple positive factors, providing crucial ignition conditions for technical breakouts and position-based trading. The US ADP employment data showed an increase of only 44,000 jobs, significantly lower than the market expectation of 70,000, directly lowering the probability of a Fed rate hike in September from nearly 70% to around 55%, marginally cooling expectations of policy tightening. Simultaneously, positive progress in US-Iran negotiations and rising expectations for the opening of the Strait of Hormuz led to a single-day drop in international oil prices of approximately 5.5%, effectively alleviating market concerns about inflation. Coupled with the simultaneous decline in the US dollar index and US Treasury yields, this significantly reduced the opportunity cost of holding gold as a non-interest-bearing asset, creating a perfect convergence of multiple positive factors. Other Driving Factors and Market Optimism On the funding front, the return of domestic funds has become a significant driving force. Shanghai futures gold holdings saw a substantial increase in a single day, and domestic gold ETFs experienced continuous net inflows. Goldman Sachs considers the return of domestic funds as one of the most important immediate triggers for this round of market activity. Simultaneously, the recovery sentiment following the previous sharp decline in gold prices and the influx of short-term momentum funds further amplified the rebound. While the long-term support logic of global central banks' continued gold purchases remains, its strength is moderate and cannot explain the extreme surge of over 4% in a single day. Furthermore, many institutional analysts have given more positive market forecasts. FXEmpire analyst Mohammed Umar, in his analysis on August 6th, mentioned that the expectation of the Strait of Hormuz opening and the weakening dollar are the core supports for this round of gold rebound; although weak employment data such as JOLTS job openings, factory orders, and ADP are beneficial to gold, the US ISM manufacturing and service sector data remain strong, inflationary pressures have not completely subsided, and the Federal Reserve's policy stance remains cautious. He further pointed out that if the weekly closing price of gold stabilizes above $4,330, it will officially confirm a medium- to long-term bullish breakout, and further discussed the possibility of gold prices hitting the $5,000 mark after the release of the non-farm payroll data. This optimistic view regards the current oversold rebound as the starting point of a new bullish trend, but the core premise still relies on the positive support of the non-farm payroll data and confirmation of a weekly breakout. In summary, the current gold market rally can be described as a multi-faceted resonance of macroeconomic factors, technical breakout, position squeeze, and a breakout after prolonged consolidation. While there is clear support for the market direction, the extreme upward movement is more a result of the resonance between technical structure and position funds, rather than purely fundamental drivers. The core unexplained question of this rally : Even if the market provides a complete logic for the rise, a review of the details and historical patterns reveals many logical inconsistencies and contradictions in this surge, with the underlying driving logic remaining unclear. First, the adjustment in interest rate hike expectations is limited and insufficient to trigger an extreme market movement. The probability of a September rate hike has dropped from 70% to 55%, representing only a marginal cooling and not a turning point towards monetary policy easing. Historically, adjustments in rate hike expectations of similar magnitude typically result in only a normal fluctuation of around 1% in gold prices, never a single-day surge of 4%. Furthermore, the intraday fluctuations in the US dollar index and real interest rates, combined with historical volatility sensitivity calculations for gold, are completely incompatible with this round of extreme price increases. Secondly, there is a logical paradox regarding geopolitical benefits. The repeated fluctuations in the Middle East situation and the news speculation surrounding US-Iran negotiations have already been fully priced into the market over the past few months and are not sudden positive developments. While the decline in oil prices has indeed eased short-term inflationary pressures, the logic of "ease of geopolitical tensions and a rebound in risk sentiment driving a surge in gold prices" contradicts gold's traditional safe-haven attributes. If market risks truly cool down, the demand for gold as a safe haven should decline; the counterintuitive market movement further illustrates that this round of gains is not driven by rational fundamentals. The most crucial variable remains the yet-to-be-released non-farm payroll data. ADP is only a leading indicator for non-farm payrolls, and the two often diverge, limiting its reference value. If the non-farm payroll data unexpectedly strengthens, the resilience of the US job market will continue, and expectations of a Fed rate hike will rebound rapidly. The dollar and US Treasury yields will rise in tandem, and the significant gains accumulated in gold prices in this round will likely face a rapid pullback. Currently, gold prices have quickly broken out of their long-term trading range, and short-term overbought signs are very evident. The market's optimistic interpretation of a "breakout to $5,000" precisely exposes the fatal weakness of this rally: it is highly dependent on subsequent positive data and has not yet formed an independent, solid medium- to long-term upward logic. Furthermore, the institutional funding structure does not support a trend reversal. Currently, there is no large-scale institutional allocation entering the market; the core driving force behind this rally is merely the concentrated liquidation of CTA short positions and short-term momentum funds following the trend. A market with this funding structure has extremely strong short-term explosive power, but it is highly volatile, unstable, and its sustainability is questionable. The core risks hidden in current gold prices : In summary, the violent surge before the non-farm payroll data is essentially a technical breakout combined with position squeezing and a breakout from a long-term sideways consolidation, a temporary impulsive move, not a confirmation of a complete reversal of the medium- to long-term trend. The market harbors multiple risks of a pullback. Technical factors and market sentiment have been rapidly overextended in the short term, with bullish sentiment becoming excessively hot, easily triggering profit-taking and suppressing upward price potential. The non-farm payroll data is currently the biggest uncertainty; if the employment data is stronger than expected, the market's macroeconomic narrative will instantly reverse, and the positive logic will completely fail. In terms of capital structure, the current market's buying power is extremely weak. As the CTA short-covering rally nears its end, without new medium- to long-term bullish funds to take over, the market will experience a buying gap, and downward pressure will continue to be released. In the long term, global central bank gold purchases can provide a bottom support for gold prices, but cannot drive a sustained and significant price increase. What truly determines the medium- to long-term trend of gold remains the Fed's interest rate path and global macroeconomic capital flows. Even if the market is discussing a potential move towards $5000 after stabilizing above $4330 on the weekly chart, the prerequisites are stringent, and the upward uncertainty is extremely high. The core positive logic for gold in the long term—de-dollarization, foreign exchange reserve diversification, and global macroeconomic uncertainty—has not faded, but this round of short-term surge is clearly driven by excessive position-based speculation and market sentiment. Before the non-farm payroll data is officially released and the trend is fully confirmed, remaining cautious and observing is far more rational than chasing narratives of explosive price increases. The market will always try to piece together reasonable explanations for market movements that have already occurred, but only the actual price action and capital structure can withstand review and scrutiny. The upcoming non-farm payroll data will ultimately provide the clearest final explanation for this sudden and extreme gold price movement.
The Mainstream Market Explanation The current market interpretation of this round of gold price surge mainly focuses on technical breakouts, range selection, position squeezing, and fundamental catalysts—these are also the most widely circulated core logics. Technical Breakout: Key Confirmation of the 50-Day Moving Average and the Downtrend Line This is also the clearest and most convincing explanation for this round of price increases. Since reaching a historical high of $5595 at the end of January, gold has entered a clear downward channel, with prices consistently suppressed by the downtrend line extending from the highs. The 50-day moving average has also consistently acted as a key resistance level. On August 5th, driven by a combination of macroeconomic news, gold prices broke through the confluence of the trend line and the 50-day moving average resistance zone near $4200 and successfully stabilized above it. (Spot Gold Daily Chart Source: FX678) This breakout of a key level carries strong technical significance: it completely ended the months-long downtrend structure, breaking the long-term weak pattern; it triggered a trend signal shift in a large number of algorithmic trading systems, with mainstream trend-following models switching to bullish signals; and it attracted concentrated short-term momentum funds, forcing existing short positions to stop-loss and cover. From a technical perspective, the breakout was accompanied by continuously increasing volume and consecutive positive price increases, typical characteristics of a breakout with high volume. Most traders define this effective breakout as a crucial signal that the market is shifting from "consolidation and correction" to "trend reversal." Compared to short-term news stimuli, the fundamental technical structure breakthrough is the core reason why this round of price increases far exceeds normal fluctuations. Directional Choice After Consolidation Looking at a longer timeframe, gold has been consolidating within the $4000-$4200 range for over a month, with a long-term balance between bullish and bearish forces and market observation. The violent surge on August 5th was essentially a definite directional choice after a long period of consolidation. Multiple factors, including positive macroeconomic catalysts and a breakthrough of key technical levels, have completely broken the stalemate within the current range. Capital markets have a long-standing rule that "prolonged consolidation inevitably leads to a direction." The longer the consolidation period, the more capital accumulates, and once a valid breakout occurs, the momentum and strength of the price surge tend to be more intense. This also reasonably explains why the recent gold price increase far exceeded the typical volatility that could be supported by a single fundamental news event. CTA Short Squeeze: Passive Rally Driven by Position Structure This is the most frequently mentioned structural logic in the market and the core of this round of price increases. Over the past few months, gold has fallen more than 24% from its historical high. During this continuous downward trend, CTA trend-following funds have continuously accumulated short positions, keeping market short positions consistently high. When the price effectively broke through the key technical threshold of $4200, algorithmic trading systems triggered a concentrated short-covering order, forcing a massive exit of short positions and creating a typical short squeeze. Multiple institutions have pointed out that this surge was not due to new long positions actively buying in large quantities, but rather a passive price increase driven by concentrated short covering. Currently, long-term institutional bulls have not truly entered the market, and with short sellers exiting en masse, the market has even briefly experienced a buying vacuum. Bloomberg strategist Cameron Crise also stated that, according to traditional macroeconomic driving models, the recent single-day increase in gold prices far exceeded reasonable expectations, representing a rare instance of gold significantly "outperforming the model" in recent years. Short-term fundamental catalysts are concentrated . This round of market movement has a textbook-level convergence of multiple positive factors, providing crucial ignition conditions for technical breakouts and position-based trading. The US ADP employment data showed an increase of only 44,000 jobs, significantly lower than the market expectation of 70,000, directly lowering the probability of a Fed rate hike in September from nearly 70% to around 55%, marginally cooling expectations of policy tightening. Simultaneously, positive progress in US-Iran negotiations and rising expectations for the opening of the Strait of Hormuz led to a single-day drop in international oil prices of approximately 5.5%, effectively alleviating market concerns about inflation. Coupled with the simultaneous decline in the US dollar index and US Treasury yields, this significantly reduced the opportunity cost of holding gold as a non-interest-bearing asset, creating a perfect convergence of multiple positive factors. Other Driving Factors and Market Optimism On the funding front, the return of domestic funds has become a significant driving force. Shanghai futures gold holdings saw a substantial increase in a single day, and domestic gold ETFs experienced continuous net inflows. Goldman Sachs considers the return of domestic funds as one of the most important immediate triggers for this round of market activity. Simultaneously, the recovery sentiment following the previous sharp decline in gold prices and the influx of short-term momentum funds further amplified the rebound. While the long-term support logic of global central banks' continued gold purchases remains, its strength is moderate and cannot explain the extreme surge of over 4% in a single day. Furthermore, many institutional analysts have given more positive market forecasts. FXEmpire analyst Mohammed Umar, in his analysis on August 6th, mentioned that the expectation of the Strait of Hormuz opening and the weakening dollar are the core supports for this round of gold rebound; although weak employment data such as JOLTS job openings, factory orders, and ADP are beneficial to gold, the US ISM manufacturing and service sector data remain strong, inflationary pressures have not completely subsided, and the Federal Reserve's policy stance remains cautious. He further pointed out that if the weekly closing price of gold stabilizes above $4,330, it will officially confirm a medium- to long-term bullish breakout, and further discussed the possibility of gold prices hitting the $5,000 mark after the release of the non-farm payroll data. This optimistic view regards the current oversold rebound as the starting point of a new bullish trend, but the core premise still relies on the positive support of the non-farm payroll data and confirmation of a weekly breakout. In summary, the current gold market rally can be described as a multi-faceted resonance of macroeconomic factors, technical breakout, position squeeze, and a breakout after prolonged consolidation. While there is clear support for the market direction, the extreme upward movement is more a result of the resonance between technical structure and position funds, rather than purely fundamental drivers. The core unexplained question of this rally : Even if the market provides a complete logic for the rise, a review of the details and historical patterns reveals many logical inconsistencies and contradictions in this surge, with the underlying driving logic remaining unclear. First, the adjustment in interest rate hike expectations is limited and insufficient to trigger an extreme market movement. The probability of a September rate hike has dropped from 70% to 55%, representing only a marginal cooling and not a turning point towards monetary policy easing. Historically, adjustments in rate hike expectations of similar magnitude typically result in only a normal fluctuation of around 1% in gold prices, never a single-day surge of 4%. Furthermore, the intraday fluctuations in the US dollar index and real interest rates, combined with historical volatility sensitivity calculations for gold, are completely incompatible with this round of extreme price increases. Secondly, there is a logical paradox regarding geopolitical benefits. The repeated fluctuations in the Middle East situation and the news speculation surrounding US-Iran negotiations have already been fully priced into the market over the past few months and are not sudden positive developments. While the decline in oil prices has indeed eased short-term inflationary pressures, the logic of "ease of geopolitical tensions and a rebound in risk sentiment driving a surge in gold prices" contradicts gold's traditional safe-haven attributes. If market risks truly cool down, the demand for gold as a safe haven should decline; the counterintuitive market movement further illustrates that this round of gains is not driven by rational fundamentals. The most crucial variable remains the yet-to-be-released non-farm payroll data. ADP is only a leading indicator for non-farm payrolls, and the two often diverge, limiting its reference value. If the non-farm payroll data unexpectedly strengthens, the resilience of the US job market will continue, and expectations of a Fed rate hike will rebound rapidly. The dollar and US Treasury yields will rise in tandem, and the significant gains accumulated in gold prices in this round will likely face a rapid pullback. Currently, gold prices have quickly broken out of their long-term trading range, and short-term overbought signs are very evident. The market's optimistic interpretation of a "breakout to $5,000" precisely exposes the fatal weakness of this rally: it is highly dependent on subsequent positive data and has not yet formed an independent, solid medium- to long-term upward logic. Furthermore, the institutional funding structure does not support a trend reversal. Currently, there is no large-scale institutional allocation entering the market; the core driving force behind this rally is merely the concentrated liquidation of CTA short positions and short-term momentum funds following the trend. A market with this funding structure has extremely strong short-term explosive power, but it is highly volatile, unstable, and its sustainability is questionable. The core risks hidden in current gold prices : In summary, the violent surge before the non-farm payroll data is essentially a technical breakout combined with position squeezing and a breakout from a long-term sideways consolidation, a temporary impulsive move, not a confirmation of a complete reversal of the medium- to long-term trend. The market harbors multiple risks of a pullback. Technical factors and market sentiment have been rapidly overextended in the short term, with bullish sentiment becoming excessively hot, easily triggering profit-taking and suppressing upward price potential. The non-farm payroll data is currently the biggest uncertainty; if the employment data is stronger than expected, the market's macroeconomic narrative will instantly reverse, and the positive logic will completely fail. In terms of capital structure, the current market's buying power is extremely weak. As the CTA short-covering rally nears its end, without new medium- to long-term bullish funds to take over, the market will experience a buying gap, and downward pressure will continue to be released. In the long term, global central bank gold purchases can provide a bottom support for gold prices, but cannot drive a sustained and significant price increase. What truly determines the medium- to long-term trend of gold remains the Fed's interest rate path and global macroeconomic capital flows. Even if the market is discussing a potential move towards $5000 after stabilizing above $4330 on the weekly chart, the prerequisites are stringent, and the upward uncertainty is extremely high. The core positive logic for gold in the long term—de-dollarization, foreign exchange reserve diversification, and global macroeconomic uncertainty—has not faded, but this round of short-term surge is clearly driven by excessive position-based speculation and market sentiment. Before the non-farm payroll data is officially released and the trend is fully confirmed, remaining cautious and observing is far more rational than chasing narratives of explosive price increases. The market will always try to piece together reasonable explanations for market movements that have already occurred, but only the actual price action and capital structure can withstand review and scrutiny. The upcoming non-farm payroll data will ultimately provide the clearest final explanation for this sudden and extreme gold price movement.
- Risk Warning and Disclaimer
- The market involves risk, and trading may not be suitable for all investors. This article is for reference only and does not constitute personal investment advice, nor does it take into account certain users’ specific investment objectives, financial situation, or other needs. Any investment decisions made based on this information are at your own risk.