Institutions: Gold and silver price pullback does not signify the end of the bull market; the long-term investment logic remains intact.
2026-08-11 11:08:55
After a significant surge in prices, gold and silver experienced a notable pullback in 2026, leading many market participants to worry that the long-term bull market for precious metals had come to an end. However, Maria Smirnova, Managing Partner of Sprott Inc., Senior Portfolio Manager, and Chief Investment Officer of Sprott Asset Management, offered a different perspective in her latest report. She believes the recent decline is merely a cyclical correction within the bull market, and that core supporting factors such as sovereign debt, central bank gold purchases, and geopolitical dynamics have not disappeared. Furthermore, silver is further supported by industrial demand, suggesting that gold and silver still possess long-term investment value.
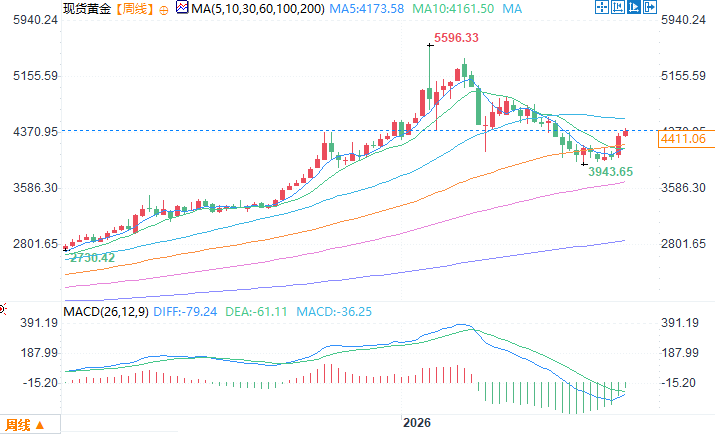 Spot gold weekly chart source: FX678. As of 11:06 AM Beijing time on August 11, spot gold was trading at $4413.26 per ounce.
Periodic pullbacks do not change the underlying fundamentals of precious metals
Looking back at the market trends of the past two years, gold and silver experienced a spectacular upward trend in 2025. Spot gold rose by over 64.58% throughout the year, while spot silver rose by 147.95%. This rally was driven by large-scale gold purchases by central banks worldwide, inflationary concerns, sovereign debt expansion, and geopolitical risks. At the end of January 2026, both precious metals again broke historical records. Smirnova stated that after peaking in January, gold and silver underwent a correction, with prices falling sharply in the second quarter. Gold fluctuated between $4,000 and $4,100 per ounce, while silver fell to $55 to $60 per ounce. Even with the decline, both prices remained higher than the same period last year. With rising safe-haven demand in the Middle East, prices have recently begun to rebound. This correction is more attributable to short-term liquidity and cyclical factors such as a stronger dollar, rather than a deterioration in fundamentals. The continued expansion of sovereign debt, persistently high fiscal deficits, the diversification of reserve assets by many central banks, and the divergence in the global geopolitical landscape continue to provide solid support for gold. For silver, the continuous industrial demand driven by photovoltaic power generation, power grid construction, AI infrastructure, and the high-end electronics industry, coupled with weak growth in mine supply, has resulted in a supply-demand gap in the market for several consecutive years. She stated that market volatility is merely testing investors' confidence in their positions and has not undermined the long-term bull market foundation for precious metals.Analyzing the three phases of the 2026 gold market and the current state of mining stocks
The report divides the 2026 gold price trend into three stages: At the beginning of the year, gold prices reached new highs driven by debt risks and central bank gold purchases; in March, geopolitical events triggered a tightening of global liquidity, leading to leveraged funds being sold off for cash, putting pressure on gold prices. Coupled with a stronger dollar and expectations of policy tightening, gold prices weakened further in the second quarter; as early summer approached, selling pressure gradually dissipated, and physical buying and continued central bank gold purchases helped establish a bottom for gold prices. Continued buying by official departments became a key force in preventing a deep decline in gold prices. The precious metals mining sector followed the gold price correction, with a large amount of funds flowing into the technology and AI sectors, diverting funds from cyclical sectors. Smirnova stated that although stock price performance was weak, the operating quality of leading gold mining companies remained stable, with ample free cash flow, healthy balance sheets, and shareholder rewards through dividends and share buybacks, while industry mergers and acquisitions continued. However, the sector's valuation is still relatively low compared to past bull markets.The unique supply and demand pattern of silver
Unlike gold, which primarily serves as a safe-haven currency, silver possesses both monetary and industrial attributes. The silver market is smaller, with a higher proportion of leveraged trading, resulting in greater price volatility than gold. In the second quarter, the cooling of the industrial sector and the exit of speculative positions amplified the decline in silver prices. However, in the long term, the expansion of new energy and electrification industries creates rigid demand, while mineral supply struggles to keep pace, leading to continuous inventory depletion. With prices rebounding above $60 per ounce, the market is once again focusing on the structural supply and demand opportunities in silver.Conclusion
In summary, short-term interest rate and dollar-related disturbances have largely been priced into gold and silver prices. Significant fluctuations in the precious metals market are a normal phenomenon in a long-term bull market; pullbacks actually optimize the medium- to long-term risk-reward ratio. As long as structural conditions such as high debt, central bank de-dollarization, and geopolitical tensions remain unchanged, the investment logic for gold and silver will not fundamentally change. Investors should distinguish between short-term cyclical fluctuations and long-term trends. Spot gold weekly chart source: FX678. As of 11:06 AM Beijing time on August 11, spot gold was trading at $4413.26 per ounce.
- Risk Warning and Disclaimer
- The market involves risk, and trading may not be suitable for all investors. This article is for reference only and does not constitute personal investment advice, nor does it take into account certain users’ specific investment objectives, financial situation, or other needs. Any investment decisions made based on this information are at your own risk.